
Referring back to yesterday's morning S and P update we spoke about the possibility of a pinch over 1420 into 1424
"1405 remains support on the 15 min.. 1410 support on the 5 min... over 1420 on the 30 min means 1424. A level which has not been seen seen 10/23. below 1405 means we dabble with 1400-1393 again..."

|
| Daily ES_F |
Clearly the purple dotted uptrend saw a breach about a month ago precisely at 1424.. which at this very 10 seconds happens to be the current S&P 500 future price.
My going forward take.. over 1425.50 we see a move towards 1430 with 1420 remaining as support.. below 1420 air down into 1412-15.... What will help stabilize the trend is if the flow of ca$h into bonds remains moderate.
|
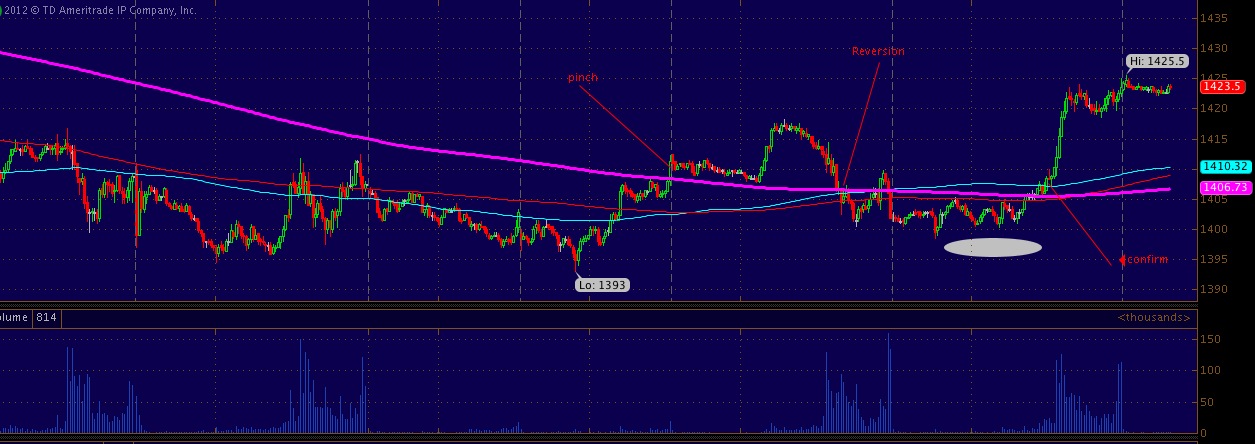
| 5 min ES_F .. note the interaction of price with the various signal lines.. |
|
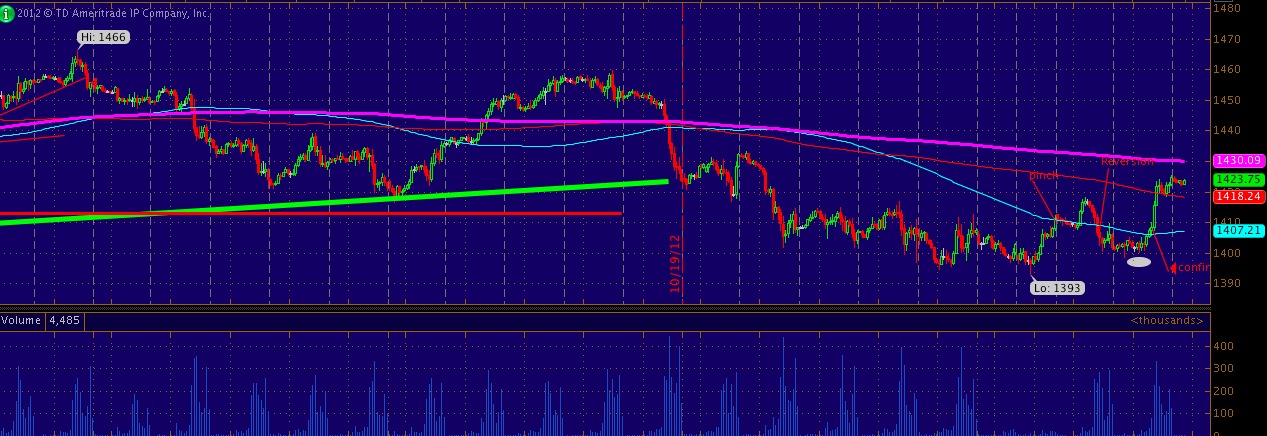
| 1 hour ES_F ... note the failure into the first of October near where the green uptrend line intersect with price at 1423 |


