Thursday, August 30, 2012

A look at the $SPX ahead of Bernanke's Jackson Hole Speech

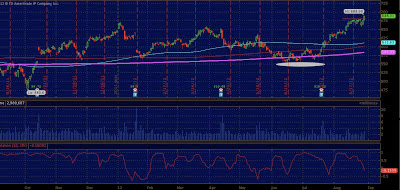
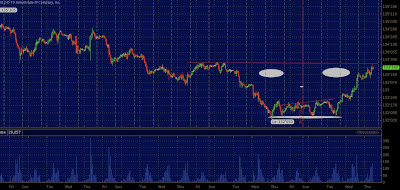
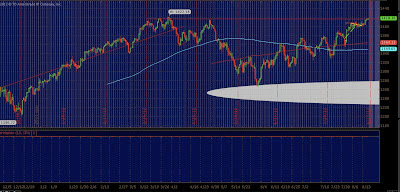
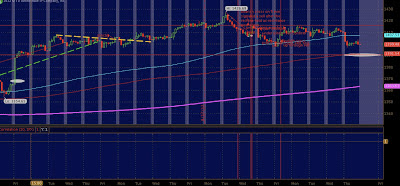
If the 1390-80 level (white oval) fails notice the pink line support @ 1363.63 
The markets have remained expectedly soft(quiet) ahead of the Kansas City Fed Jackson Hole economic summit which Bernanke will speak at 10:00 am ET tomorrow.

All signs pointed today to the removal of risk across a large range of assets in including commodities, much of which flowed into the bond market for safe keeping.

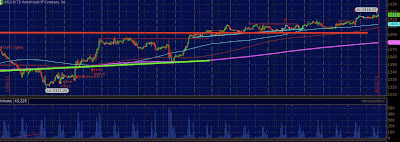
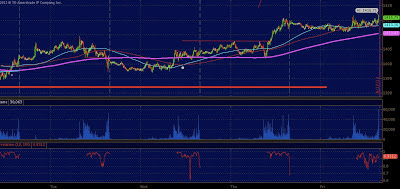
The failure of the 1409 level in the SPX this morning was a key area as it was outside of the standard deviation channel we have been chopping around in the past week and a half. Despite the afternoon bid off 1395.25 in the futures, market the sellers came right back onto the tape in the final 15 minutes of trade after cash markets closed. My guess is the goal is to create the illusion of maximum confusion ahead of whatever tomorrow brings.

Tomorrow may bring nothing but the same "hands off" rhetoric... Bernanke may very well save his bullets for a very rainy day, perhaps the day Greece KO's the euro? In any case, you can expect sellers to try and dominate the tape tomorrow because of the close under 1400 today.
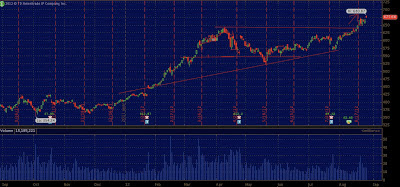
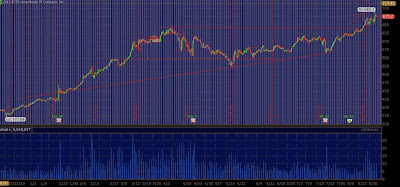
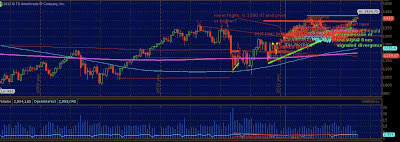
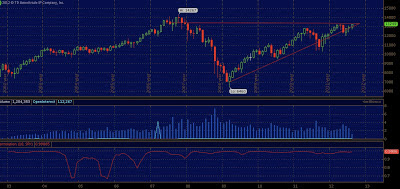
weekly SPX (notice inverse H&S pattern) SPX 1390 (purple oval)  is initial support if we give way tomorrow on the open. below that we have air gaps about ever 10 points down to 1363.63
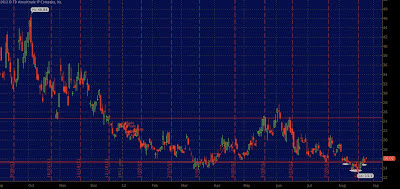
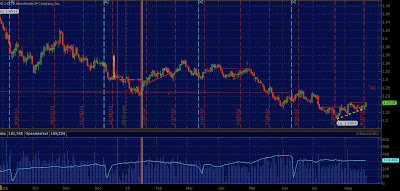
Bond markets are confirming the de-risking scenario going on the past week (back to center court)... IF it looks like Ben will be doing some stimulating i would expect a violent rotation out of bonds and into equities and commodities either via options or futures... the HFT will fluff the equities market...

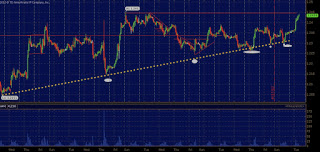
4 hou TLT
IF we get nothing.. we might just get the sell off everyone wants initially, but market might just come back under the realization the market can hold and bid and remain liquid without stimulus at this very 10 seconds. Hard to gauge what the school of fish will do when presented with a new variable.

If you are looking for real time color and analysis stop by the Trade For Profit forum tomorrow.

Wednesday, August 29, 2012

A Monthly Look at Omega Healthcare - #OHI

11 year break out.... seeing lots of charts with similar monthly patterns.....
OHI - Monthly

A look at $GOOG post chart break out

Apple broke out earlier this week.. Google's turn was today but that is ok because our eye's have been on this trade since we featured a Google chart as the "sexy chart of the day" in April of 2012...

will it last? we will have more clarity after this weekend.

Daily Goog
Monthly Goog

Thanks for reading Hedge.ly $AAPL

To all who visit Hedge.ly - Someone at Apple does care about the stock price ...
Apple post

1 hr and 5 min Charts of $GC_F (GLD)

The uptrend in place from last week broke at 1666 leading to a drop into the 1654 area before we bounced back to 1663.

now what? perhaps a test of 1668 as the volume which flushed and traded on the spike was almost 17,500 contracts.

Jackson Hole speech coming Friday.. gold and bonds will stage large moves... If he prints, gold jumps.. if he disappoints the QE seekers.. it falls... and bonds will perhaps rise...

5 min GC - note the white oval at 1668.. the up trend..
1 hour GC.. note the trend break and volume today..

Monday, August 27, 2012

A Look at the $AAPL Chart post record close of 675.68

What a difference 3 months makes? Apple was supposed to crash to 500 a shares or below according to the twitter sphere... well it did not.. and it made a new all time high today... the chart told the story... below is a daily and 4 hour time frame chart. Profits when you can.. not when you have to.
Daily Apple.. note the 640 resistance turned support level.
4 hour Apple

A Daily & hourly Look At the $VIX volatility Chart

Hourly VIX
 Clearly a inverse H&S is setting up with the break out point over 16.50 (left and right shoulder) with the top of the head 16.50 gets taken out and converted to support a new range could be created between 16 and 20, over 20 = perhaps 24.

I am aware technical analysis is hard to apply to volatility though with the upward movement in bond prices the last 5 sessions coupled with the upcoming Jackson Hole speech you should expect the unexpected.
Daily VIX

Friday, August 24, 2012

A 1 minute look at the $SPX Chart of yesterday and today

The 1400 level was defended after briefly dipping below this morning...... notice the crosses i have highlighted below.
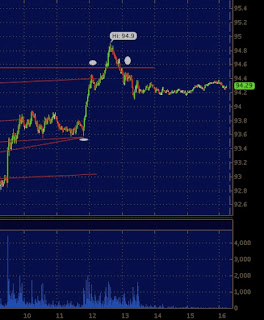
1 min SPX
Much of the above chart was annotated and shared in real time via the Trade For Profit real time forum.

Thursday, August 23, 2012

A look at the $SPX after today's "barrel of monkeys"

Metals out performed and equities & the US dollar under performed

 "US and European bond prices closed higher Thursday amid fears the european debt crisis is not yet contain." - My summation of today's price action excluding the noise. 

Bond prices continue to raise eyebrows though it seems their fall and subsequent rise this month is all to much all to fast to be bullish, for bond prices. The ball is in the data flow's hands....


30 min SPX.. Notice support @ 1402 
1 hour SPX.. Notice support @ 1401.70
5 min SPX.. Notice the RED dot highlighting a signal.. 

Interesting pattern emerges in the 10 year bond 1 hour chart

Hmm.... either this latest push higher has been a well played hand of cards... or this break out higher?

Free Futures trading forum - Trade for Prof.it
1 hour 

Tuesday, August 21, 2012

Where do we go from here? I have no idea $SPX - $ES_F

Trade what you are given... if you can afford to wait for the market to come to you great.. but most cannot.

Anyway the S&P 500 SPX cash market as well as futures made a new high for 2012... What do i conclude from this.. it is time to wake up from the summer coma and pay attention as it was clear today some positions were rolled around.

ES levels to watch are 1407.75 if the 1410 fails to hold throughout the evening...1407.75 fails it will convert into 1405 then the 1397-1400 fight comes into play.... upside is clear.. over 1415.50 could reverse the damage done today on the 15 min frame.... FOMC minutes tomorrow at 2:00 pm ET... be ready. watch bonds...
Monthly SPX
weekly SPX
1 hour ES_F
4 hour ES 
Daily ES

A Daily & 4 Hour chart look at the $EUR/USD

4 hour zoom 6E
As you can see this morning the eur/usd cross is bid after the 1.23 level held Monday morning. 1.25 remains the upside line in sand, which if breached could send the price to 1.26 on momentum.

In the chart on the left you can see white dots under the yellow dotted uptrending support line which denoted support being tested, if you complete the pattern you can see 1.26-1.28 as a possible target. though if the cross fails to break out 1.23 will clearly be the first line of defense down to 1.22 or even 1.20.
Commodity prices are reacting positively to 6E's strength and should this theme continue throughout today's session you should expect further upside in the S&P 500, possible over 1422. Support remains 1408-15.

Daily 6E

Friday, August 17, 2012

Monthly look at the Dow 30 futures - $YM_F

We are at a juncture.. higher or lower. u can bet it wont sit nice and pretty up here for long...
Monthly Ym 

Post OPEX $SPX and $ES_F charts

well we put in a new month high.. but still under year highs for both the ES and SPX... today looked like a consolidation day until the last few minutes when we made highs as Apple took out all time highs closing over 647 a share. This bullish price action combined with opex and thin volumes made for a perfect storm.
SPX 4 hour 
1 hour ES_F 
15 min ES 


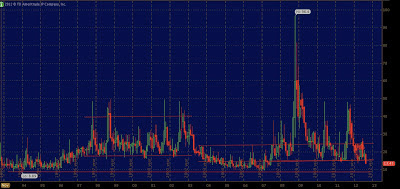
A 20 year look at the $VIX Volatility index

hmm... 10 then 8.89 is support. -
20 year VIX monthly 


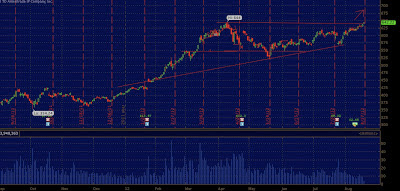
A look at $AAPL ahead of all time highs

As i stated over 644 people will chase.. they did.. new high 645.47 -

4 hour AAPL
over 644 clearly people will chase.. shorts will cover... perhaps into 650-700.. soon
Daily AAPL


Thursday, August 16, 2012

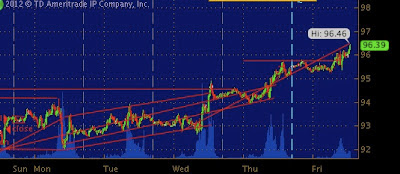
A 5 min look at $CL_F - crude oil futures

Updated chart showing 96.46 high on the old CL contract prior 2 roll (blue dotted vertical line)
15 min CL
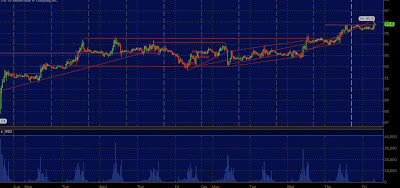
Updated chart below shows the 95.90 market.. active contract is now September
30 min CL
hmm.. 95 leve has been converted to marginal support as expected per yesterday's ramblings on the topic..
5 min CL
5 min zoom (notice the white dot yesterday at 11am


Wednesday, August 15, 2012

A look at Ultra-bond Futures $UB_F

As you can see the month of August has not been kind to bond prices, though the past 25 years.. and the last 6 months have been kind..the break of 166 led to the 163'16 low of today... Where is the bond cash going? not sure yet, but something is keeping the indexes bid as we consolidate.....

below 163'03-163 even could mean a drop into that lime green box you see below.. this area has not been visited since bond prices started to jump a the end of March/beginning of April 2012... clearly if the green area becomes the range the 146'12 level becomes major support... a break of that would mean 126'18....

i would be wary of a bounce around the 163 level, just as i would be aware it could fail.
weekly UB
Daily UB 


$CL_F 5 & 30 min Chart update

1 min CL zoom....notice the lower oval
5min CL


News or no news? doesnt matter to me.. the chart today gave us all the info you needed to draw conclusions as to where the price 'might' go....

30 min CL 


Tuesday, August 14, 2012

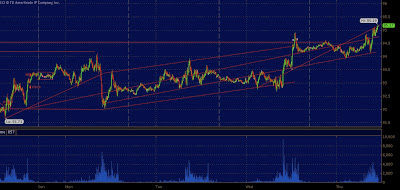
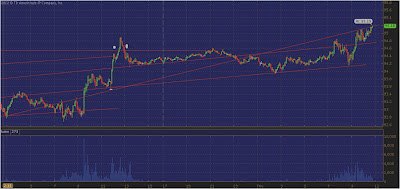
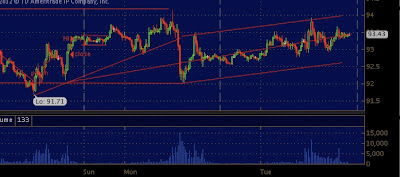
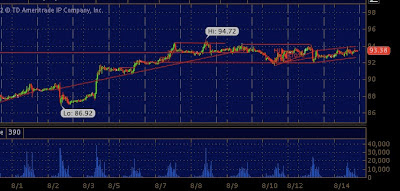
A look at $CL_F ahead of inventories at 4:30 pm ET

Either we break out over 94 on a draw or we fall to 92.50 .. if that fails 92 is a big support level from last week.
15 min  
30 min 

Monday, August 13, 2012

$SPX & $NDX chart updates

monthly SPX
The indexes continue to meander sideways -diving then......someone or something or magic keeps bringing us back to the inevitable 1400 level.. whatever the case may be you should take a look at the charts below to help craft your view...

My view is still sold up to a test of 1420 ES and 1425ish SPX before we reach a juncture..

either clean break into highs not seen since before the 2008 crisis or we fall back towards the 1300 level as the 1390-80 fails into the end of August. Time will tell, until then trade the charts no the noise.
SPX 15 min  
NDX 5 minutes (Notice tight correlation up near 2730)


Saturday, August 11, 2012

$SPX pinch into Friday close - 5 & 30 min Charts

30 min SPX
The resistance at the 1403 level gave way to 1405.87 as buyers came in during the last half hour of Friday's session. Someone must have been bullish & confident going into the weekend? Sunday & Monday should be able to answer that question...

1407.14 is the Month high for the SPX with 1422.38 being the year high and subsequent line in the sand for the bull case.. Over this level could trigger a bit of short covering from the macro crowd and chasing from the retail crowd out of fear they will be missing out.

My guess is we are a bit extended up into the 1422 area thus a retrace back into the 1390-1400 area to allow for consolidation and a base to be built for a possible move into 1450. It is what it is... Check out the TFP forum.

5 min SPX

Thursday, August 9, 2012

Gun to my head the SPX gyrates off 1402 Friday

Updated SPX chart below showing today's move off the open.. we got the gyration off 1402 alright-
5 min 
We have reached the apex of a wedge/pennant.. or better yet a precipice .... We are either going to take tomorrows import/export data at 8:30 am ET in stride (expected to show improvements in prices) or we discount them and the spoo falls... 1398 first level of support on downside followed by 95s.... upside clearly 1407.14 (Tuesday's high) then 1410+
30 min SPX
15 min SPX
1 min SPX 

Newer Posts Older Posts Home