Wednesday, July 18, 2012

4 hour $ES_F chart update

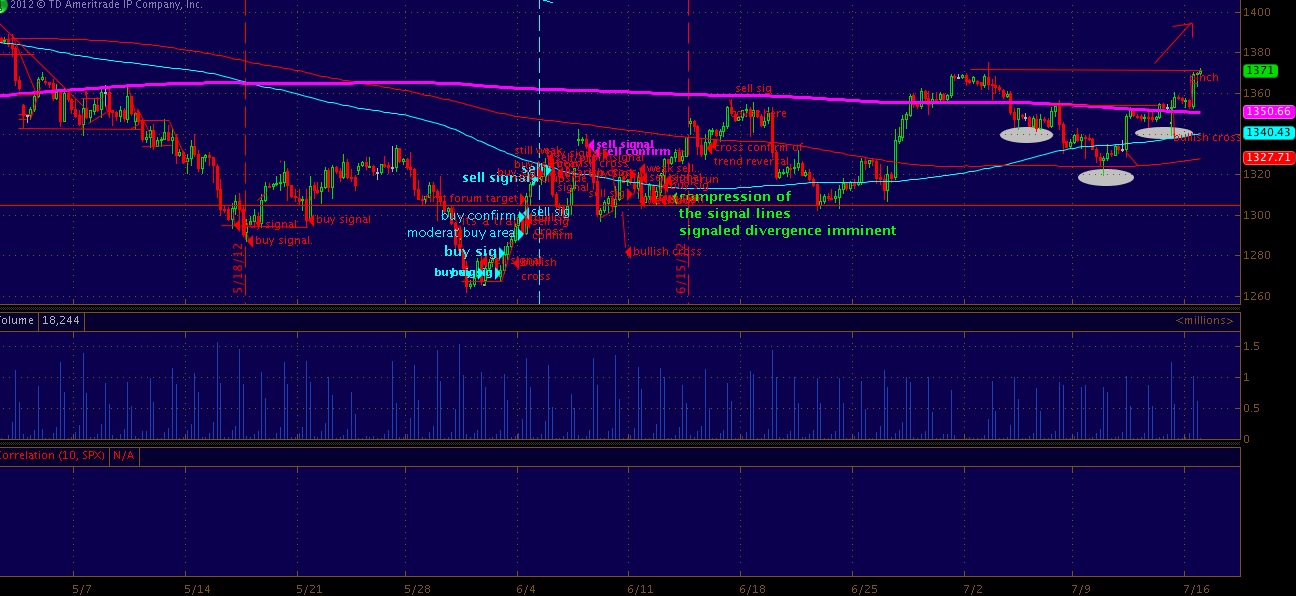
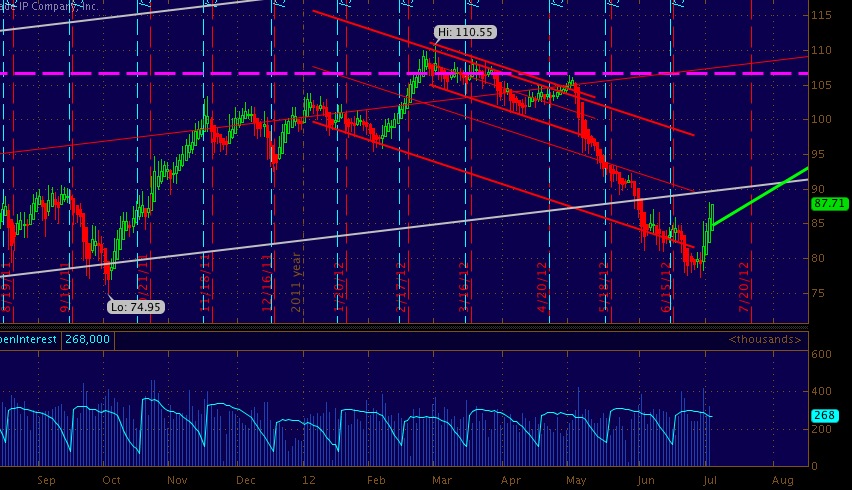
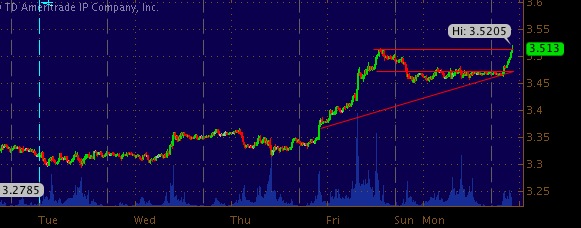
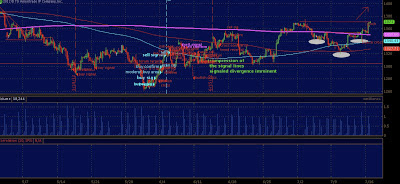
blah blah blah... u know the drill i see a inverse H&S with the head being 1320 and shoulders 1360-71.. if we break out tonight.. tomorrow.. 1400 could be in the cards.. crude's resilience over the 89 level helps the upside thesis also euro moving higher post close of europe..

 anyway.. we all know this can change on a dime.. this is why you trade what is in front of you and not what u think  will be in front of you... below 1355 if this formation fails could get silly into 1340..
be sure to check out Trade For Prof.it ... futures discussion around the clock..

Friday, July 13, 2012

1 hour S&P 500 futures Chart update

*post close update* Our 1350 target was met and exceeded as the high of the session was 1353.25.. the signals i presented gave you ample time to ride the wave i had you paddle out in front of.... you can't catch a wave unless you are positioned out in the water right?

below is the updated 1 min chart showing the break out of the inverse H&S with 1320 being the head 1330 shoulders...
1 hour ES
as you can see lots of meandering between 1320 and 1350 the past month though the fact of the matter is the ES is still higher than it was three weeks ago despite the tape and bond prices.. that being said a bit of a inverse H&S is has formed with the head being 1320 and right and left shoulders being 1330-34.

The ES price needs to get up over the pink line @ 1338.25 to signal a pinch into 1344-1350 which will present overhead resistance if and when they do come into play. Also notice the cyan line and the white oval above it on Tuesday of this week.. interesting how the cyan line turned into resistance as it broke up over the red line and fell back under on friday's close in an almost perfect radius from a epicenter of 1300.
1 hour ES

Tuesday, July 3, 2012

Weekly $CL_F chart update

now that CL_F has recovered 10 points from it's lows of 77.28 last week we should take a look at a multi year channel and a theoretical future trend. This chart contains annotations originally added to the plot on June 26, 2012 .

weekly zoom CL_F 
Daily CL 

Tuesday Morning $CL_F 15 min chart update

82 converted to support as an inverse H&S launched oil's price over the 85.50 resistance level converting it to support. over 86.50 could mean 87 easily..
15 min CL

Monday, July 2, 2012

Monday night 30 min Copper chart update

3.5 converted to support this past friday .. now with the new high for July being 3.5205.
HG 30 min 

Newer Posts Older Posts Home