During the past five weeks a commonality between Apple and the greater market has been general headline* UNrelated weakness....... Question is.... Did we put the horse behind the cart? In other words did the market lead Apple lower or did the market followApple lower?
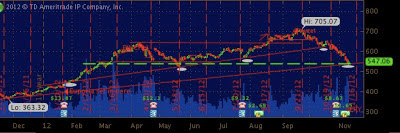
|
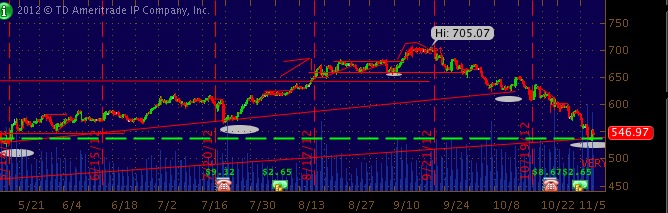
| 4hour AAPL |
In my humble non-scientific opinion they both led each other lower through a self fulfilling prophecy of "if Apple is weak the market must be a sell"...like a echo chamber....
In a day in age where the entire market is tied together via ETF's and other instruments which drive up correlations to record levels the indexing of high cap stocks create systemic problems.

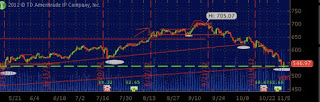
|
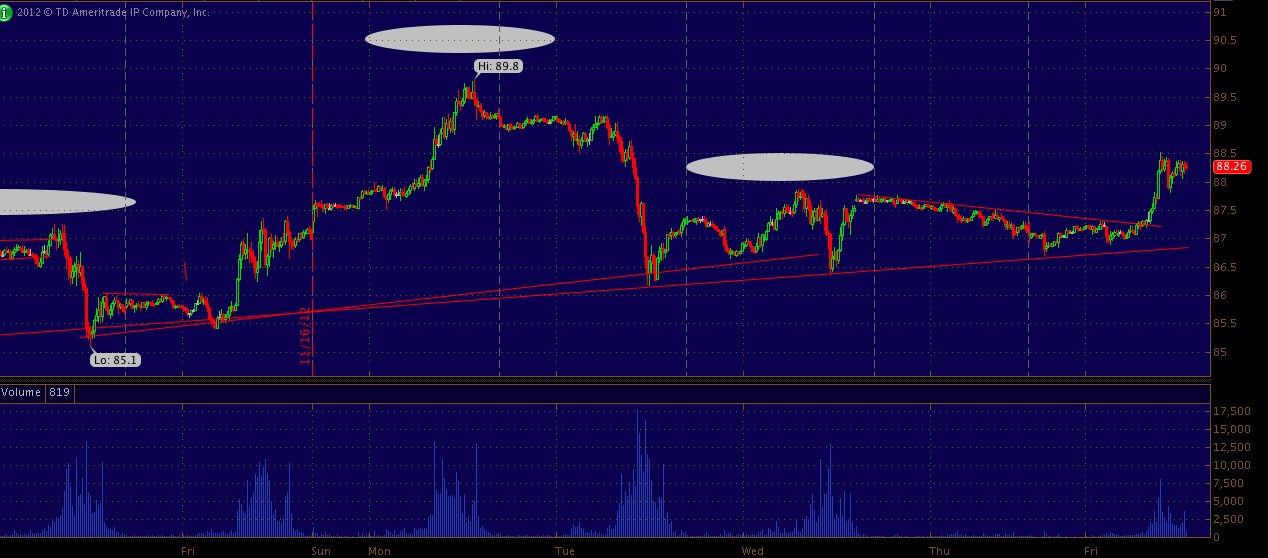
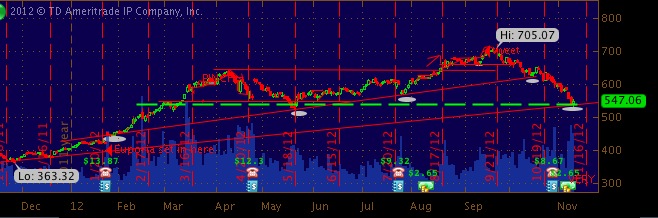
| 1 hour - note the white dot(s) |
Due to Apple's large weighting within the indexes, especially the NDX and SPX it's weakness caused a vacuum within the market which many different ETF's mirrored and added vacuum to the already strong force of the psychology behind a market leading stock dropping 3% day after day. The vacuum never stops, just works in reverse pushing stock prices up as quickly as they fall.....
This positive and negative vacuum action exaggerates the sine wave like manic price action we have come to know.
Perhaps Apple would not have fallen as quickly as it did if it were not for all the extraneous factors affecting its price beyond investor A wanting to sell to investor B.....

|
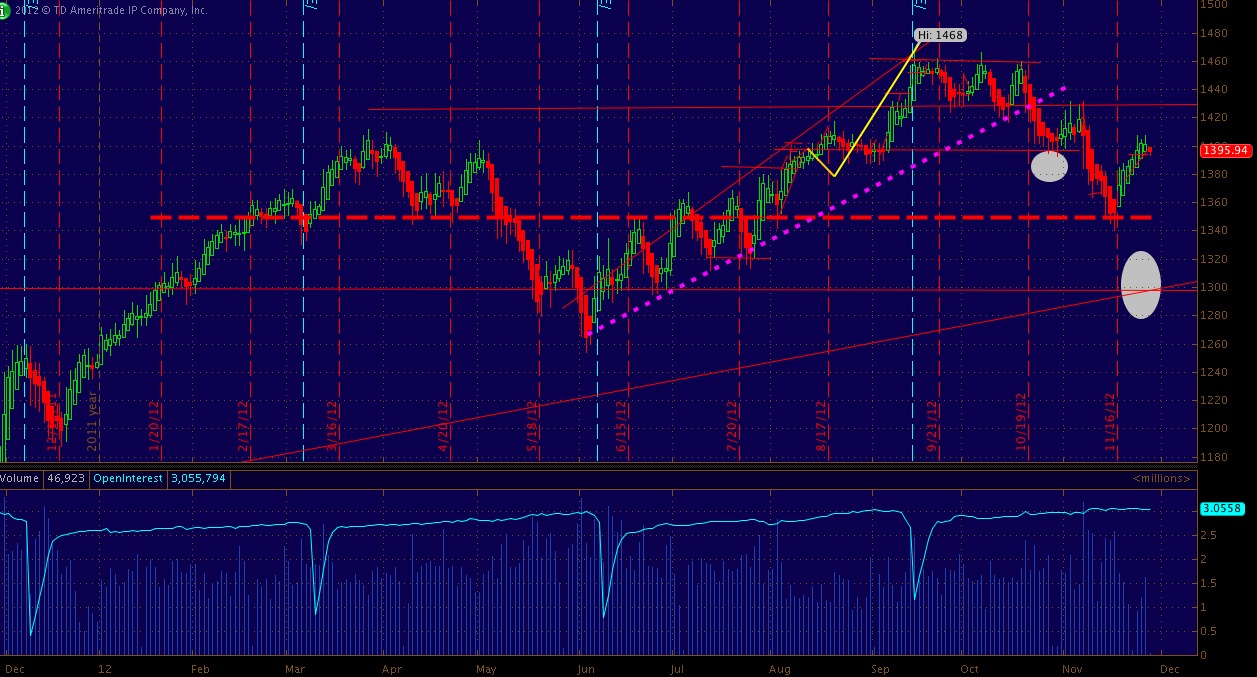
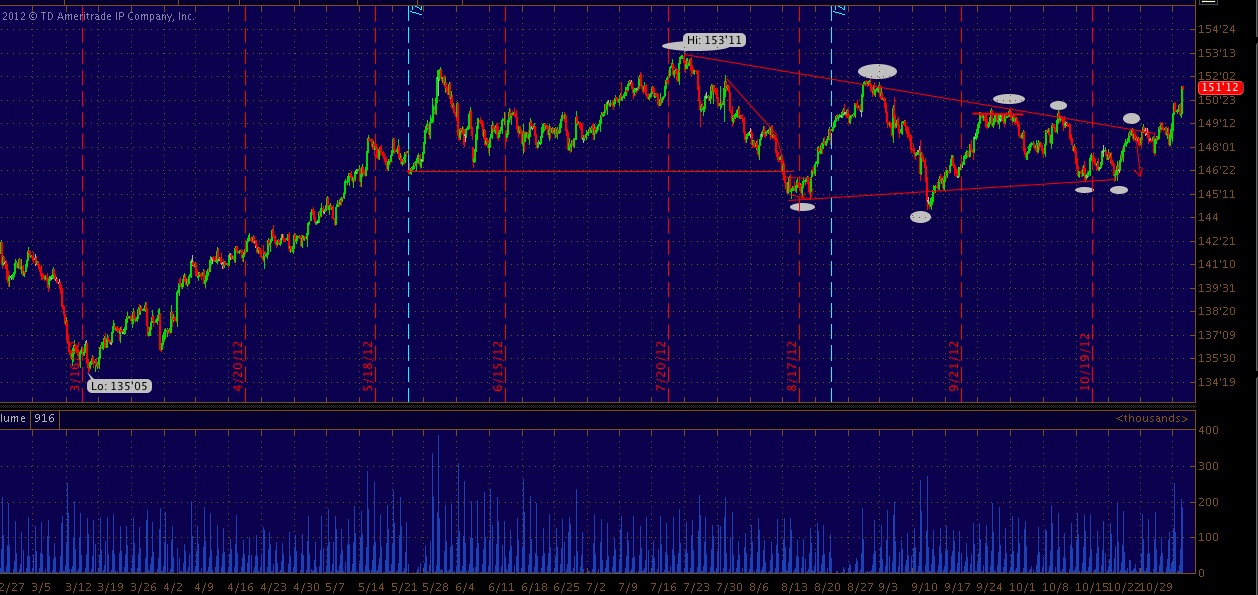
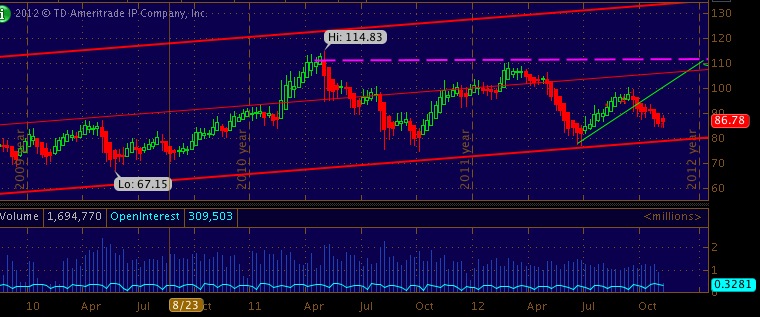
| Weekly AAPL.. notice what resides under 540-500 (air) |
The charts above and below are of Apple in many different time intervals... What i want you to focus on is is the 540 level and the support which has been built at this level going back to march and june of 2011 (white ovals) Also make note of the December 20012 resistance at 400 a share.. this level gave way to almost 205 points of upside... LOTS of funds i am sure are long from this area and will be in a position to protect profits as this level approaches.... Of course this level is only a concern if the 540 level fails into 500.....

|
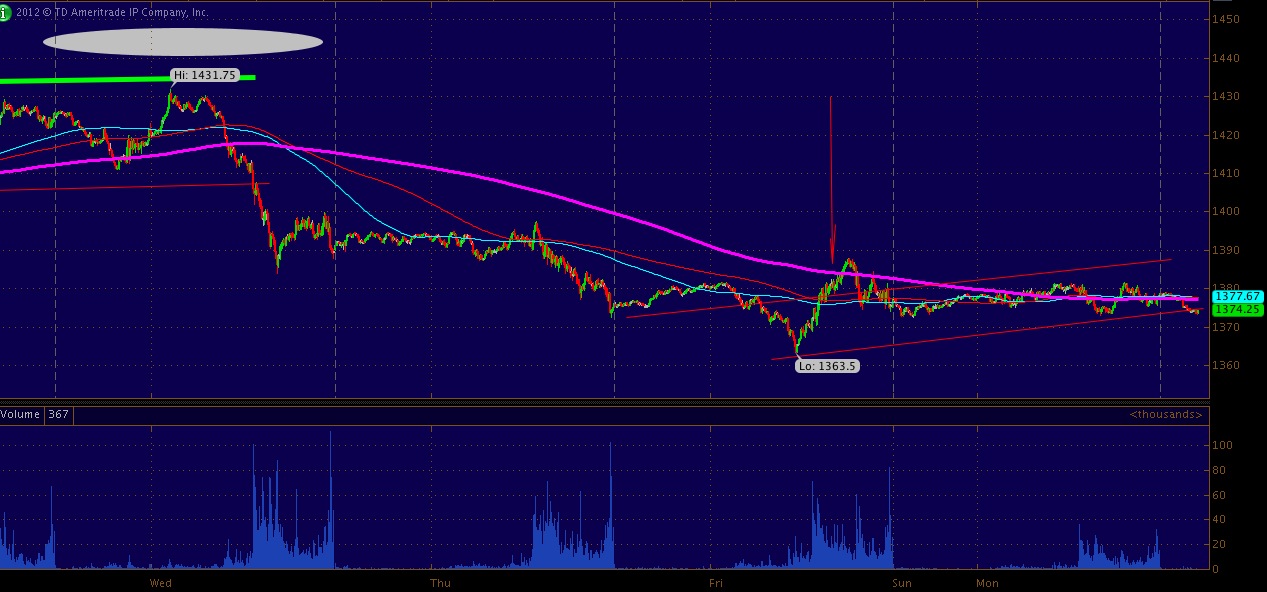
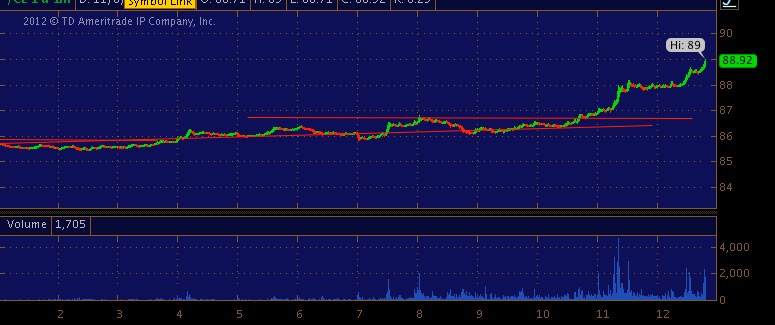
| 4 hour ZOOM |
|
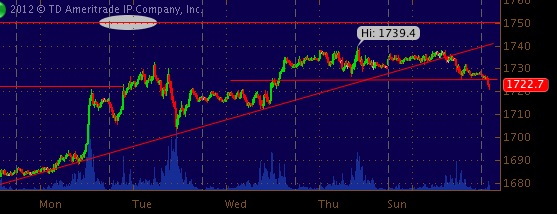
| Daily |