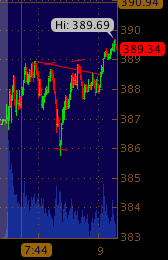
Friday, September 30, 2011

Post Cash Close Emini Chart (SPX)

the 1130 was breached with conviction 1122 was the low.. quick trade easy set up. you could have waited all day for this.. i did.
5 min

LATE Friday S&P500 5min Chart(s) (SPY)

Slow grind down today after yesterday afternoons typical squeeze higher which amounted to nothing but an opportunity to get short.  the downside lines of the triangle are in yellow... the hypotenuse is becoming elongated as the price nears the apex.. this usually mean a break out is soon to come.. either down or up.. i feel down 1125 and below means 1110.

Crude oil below 80 was signaled yesterday by the steep ranges and refusal to stay over 83. Equities followed as the DX pushed back over the 79 level.. over 79 equites and crude feel the heat.
15 MIN inset and 5 min larger ES_F ..

Thursday, September 29, 2011

Worth Noting - S&P

ES_F  1 min.. .

Thursday Evening S&P500 Chart 5min (SPY)

ES 5 min
1160 faded again... 1150 support... 1138 hard line break down point.. anything above the  1140 is inside the descending triangles body. as the hypotenuse grows longer toward the apex, upside pops will be limited and and price will become more congested.  Remember the biggest moves happen when you least expect them. Tomorrow is a holiday.

Silver and gold are trading inverse equities and crude. Watch for the 82 level to possible break on the downside.. over 83.5 CL could hit some buy stops. Gold over 1645 could trigger more stops.

Post Close 15min S&P500 Chart

Today's last 45 min rally was reminiscent of monday's last hour squeeze and last thursday.. you can see this in the chart below. we were staring at 1130 an hour ago.. now we are looking @ 1160 .
15 min ES_F 

Intra Day NetFlix Chart 1 min. (NFLX)

nflx 1 min.. focus on the descending triangle and the unbroken hypotenuse 

Afternoon S&P500 Chart Update (SPY)

1160 rejected led to a test of 1154 and perhaps 1150.. below 1150 sell stops lurk.
5 min ES

Crude Oil Head & Shoulders On 1 Min (USO)

chart -update post break of 80 a bbl
5 min CL
over 84 the head and 82.75 the left and right shoulders...
1 min CL 

NetFlix Monthly Chart Update (NFLX)

Original chart was posted july 25th  as i noticed a right triangle forming... 300 was the top of the hypotenuse.  Today's chart is below with another -11% day down to the 115 level.
monthly nflx

Morning S&P500 Equity Index Future Chart (SPU)

5 min.. 


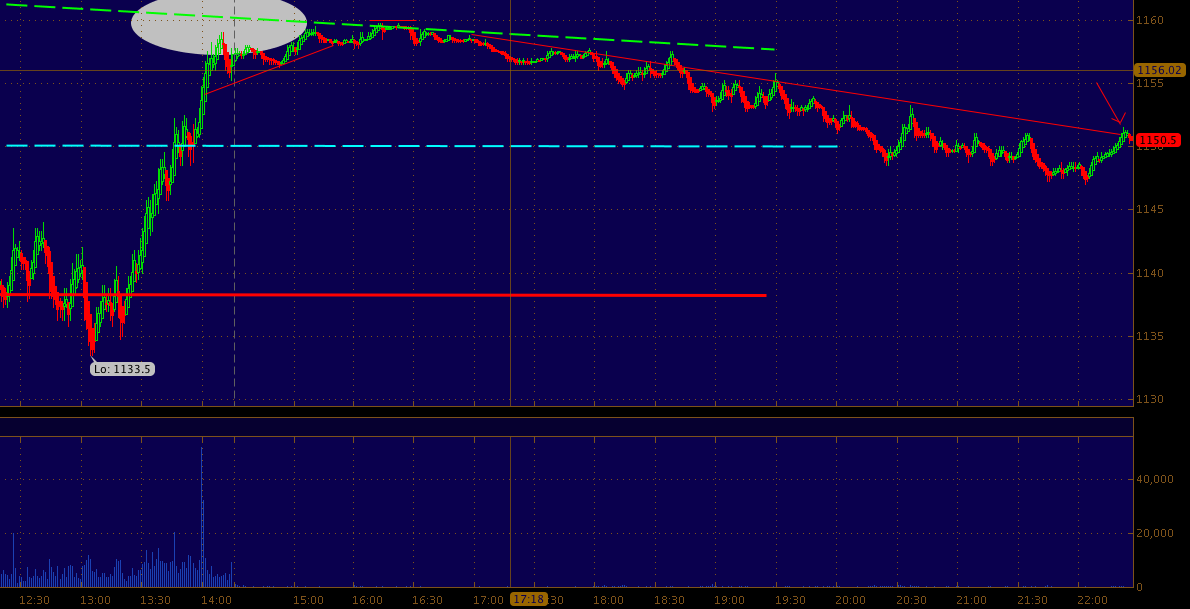
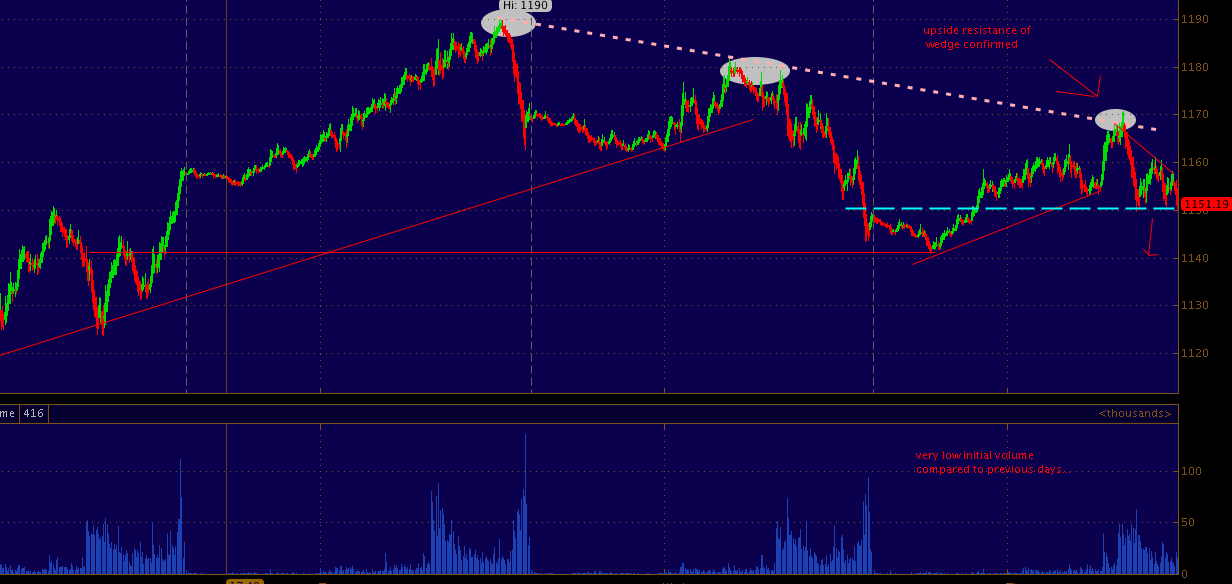
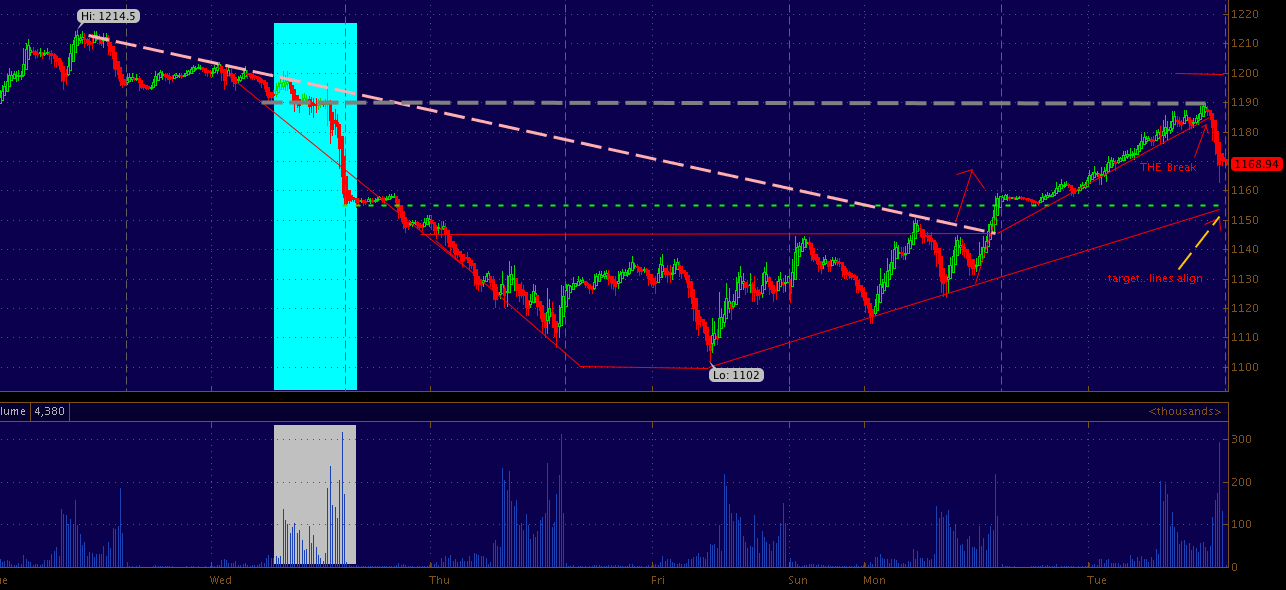
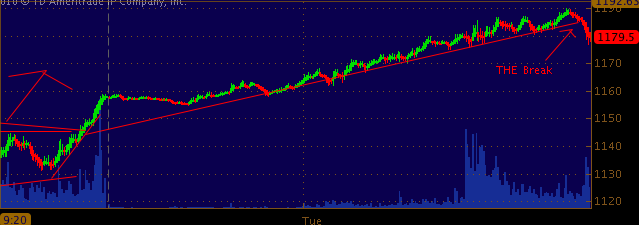
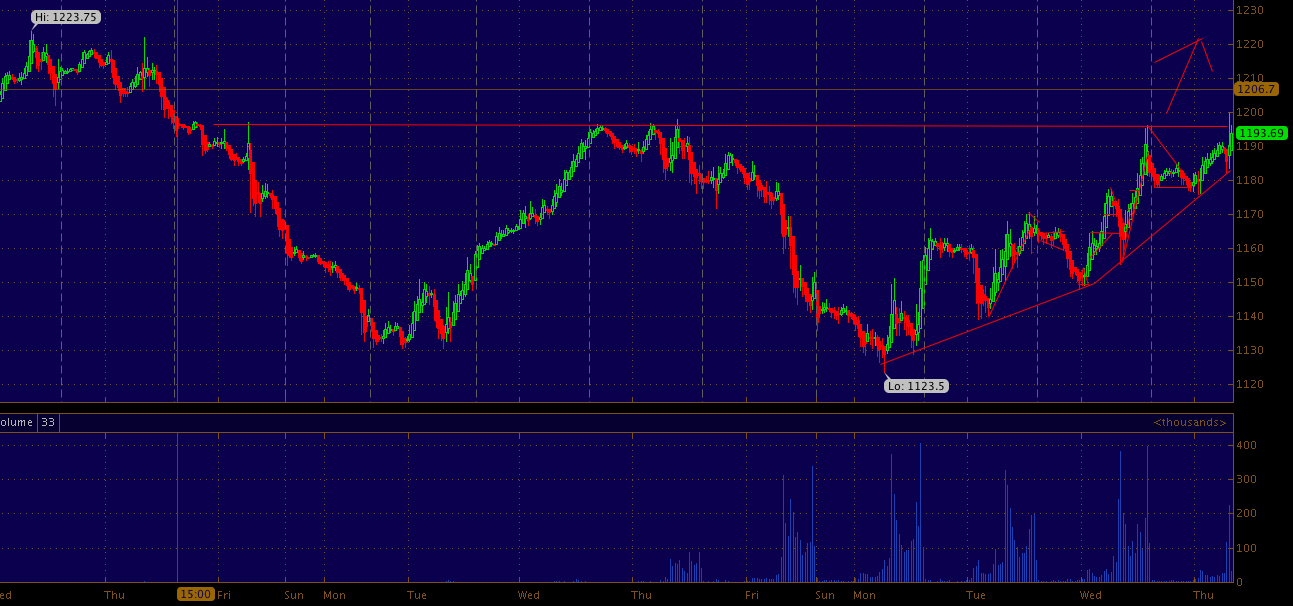
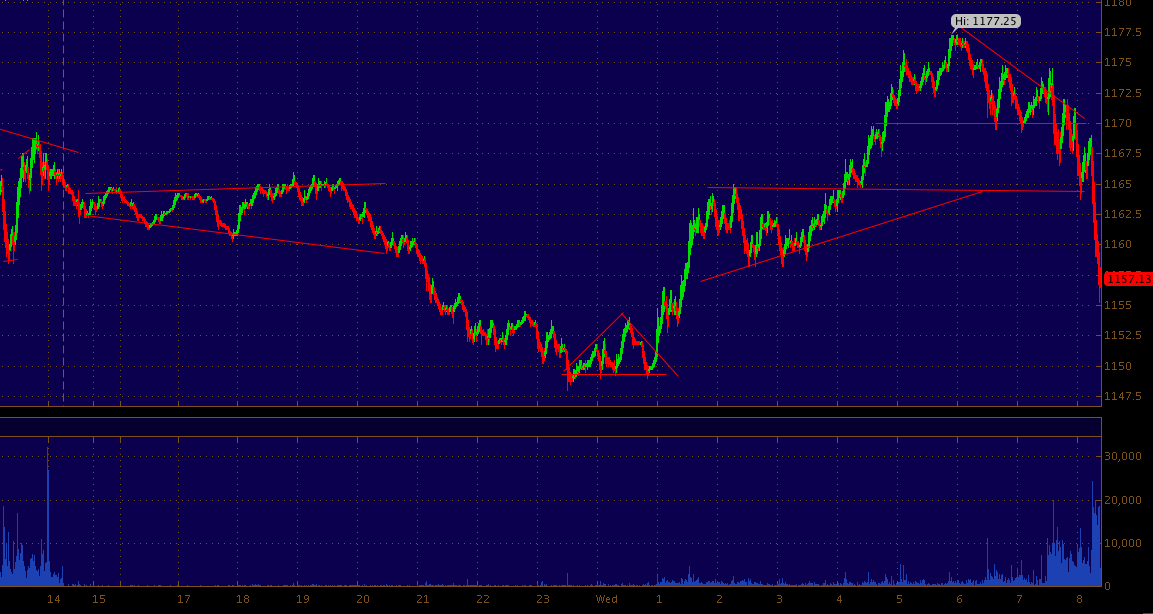
sure enough the 1170 area was a pivot which collided with the resistance of the wedge.. dotted line..looking at the 1157 level as it is sticky.. we stay below market could stay offered.
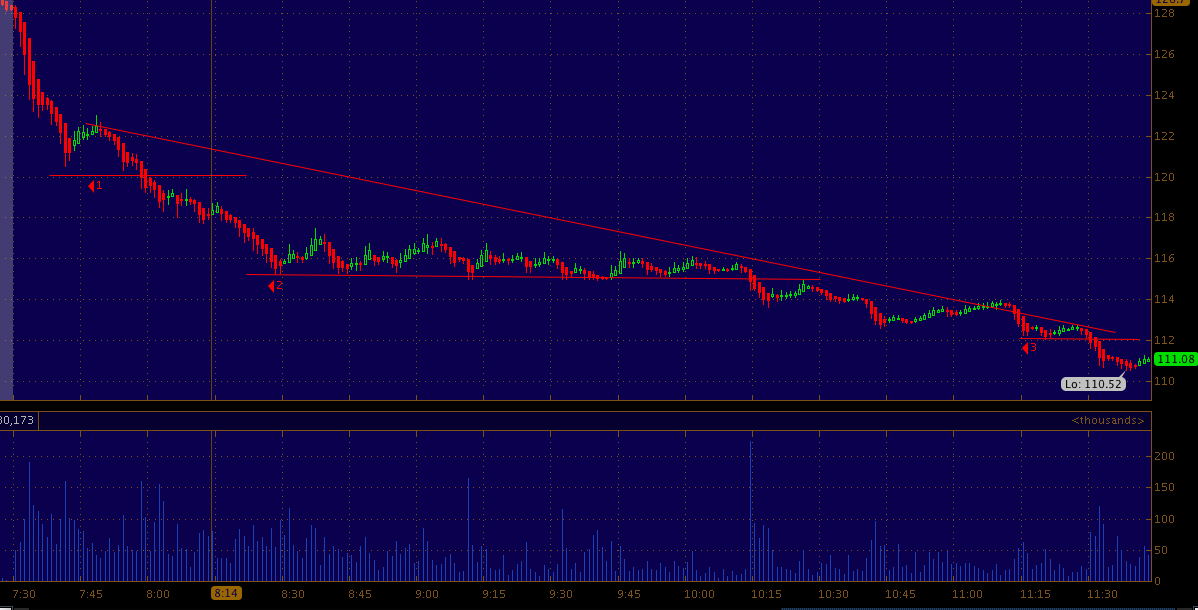
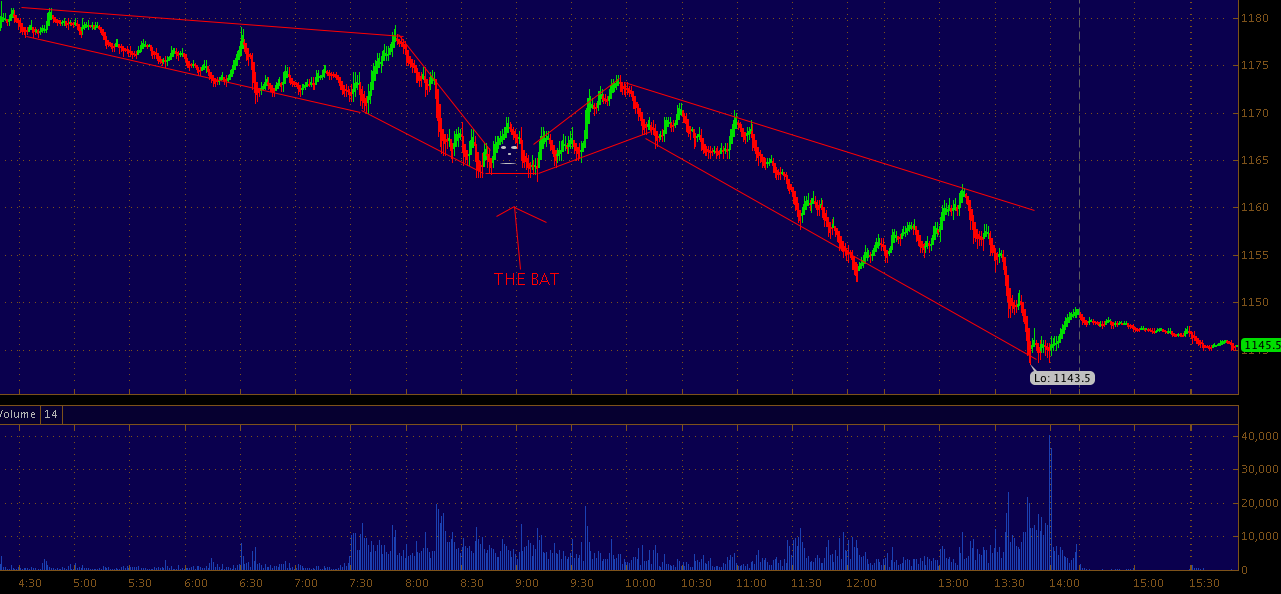
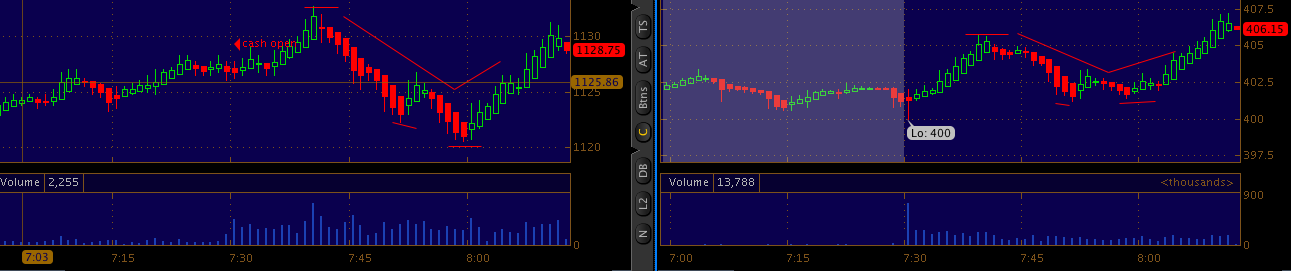
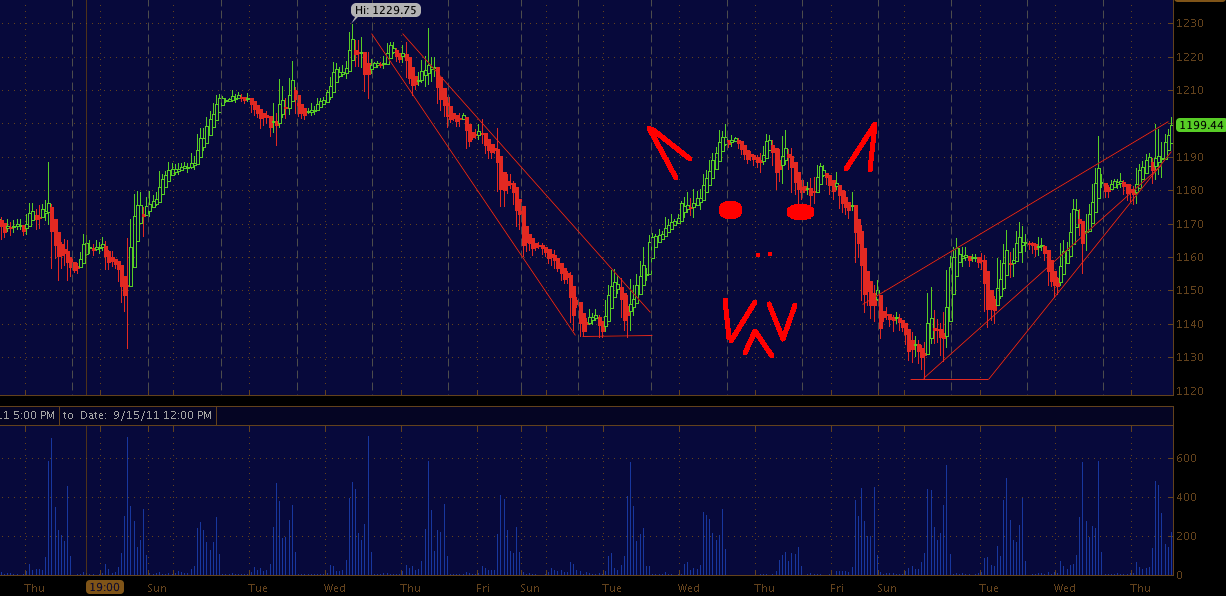
Up UP and away best sums up the price action leading up to the cash open.. some how we managed to run up 1.45% post a 37k decline in jobless claims.. woo freaking hooo..yesterday the 1165 leve presented support and 1175 was the tipping point for selling post left BAT wing.

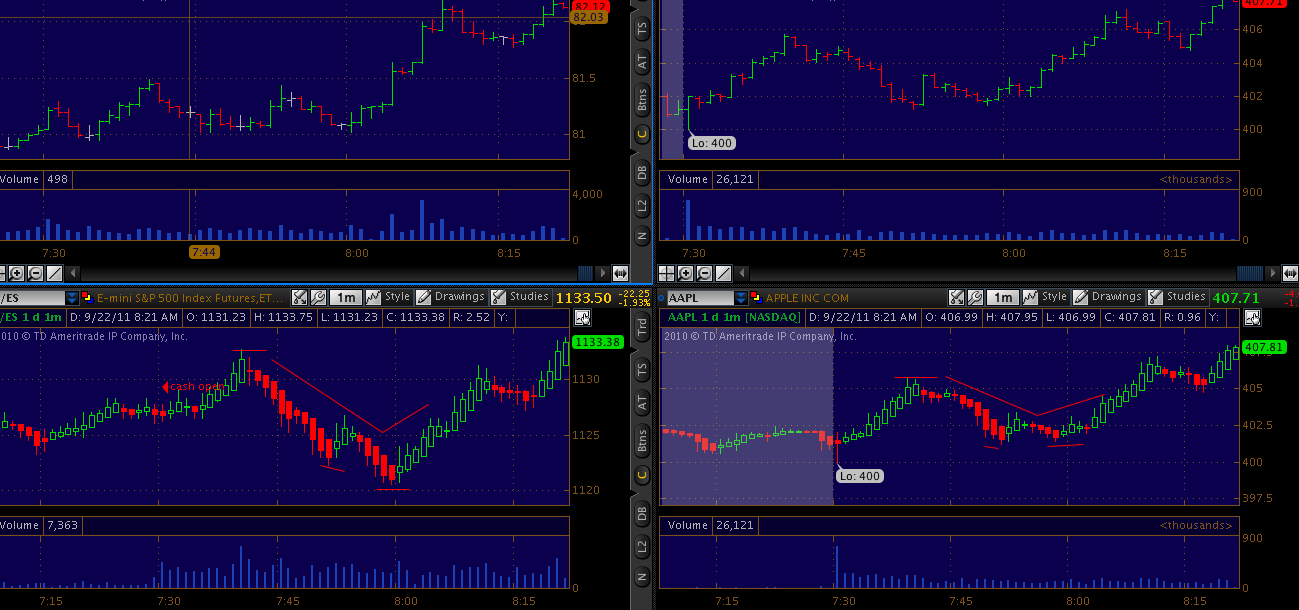
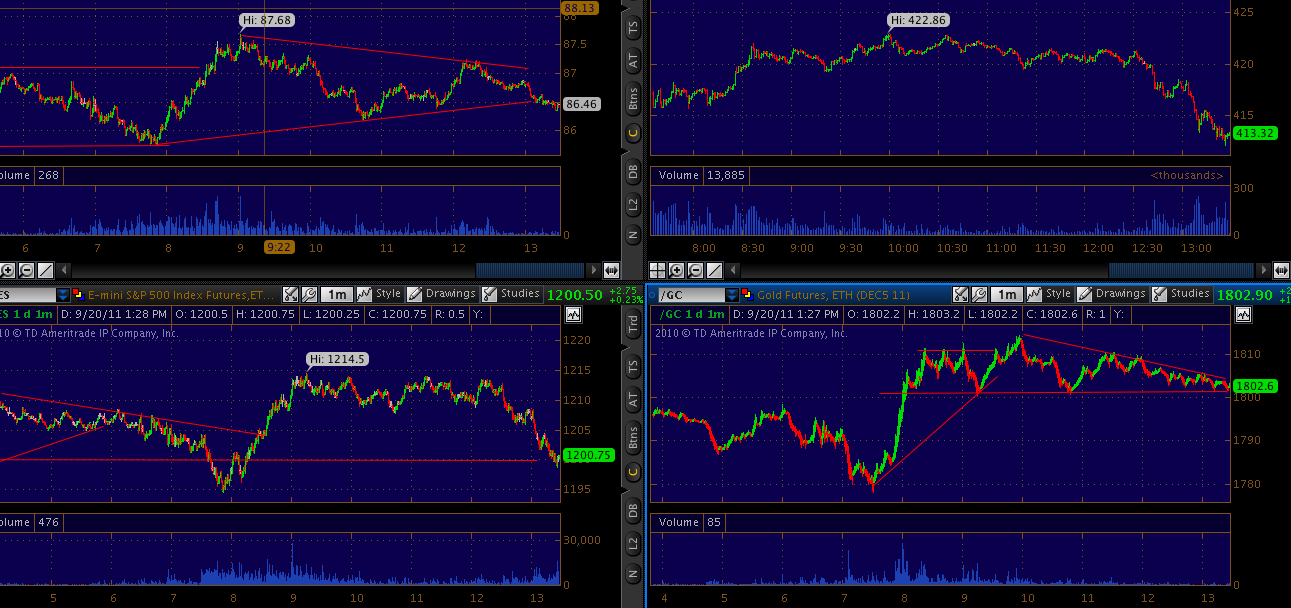
With just about all futures and commodities trading in line with each other this morning you can expect some unexpected moves in today's session. High correlation going into cash open = looseness.

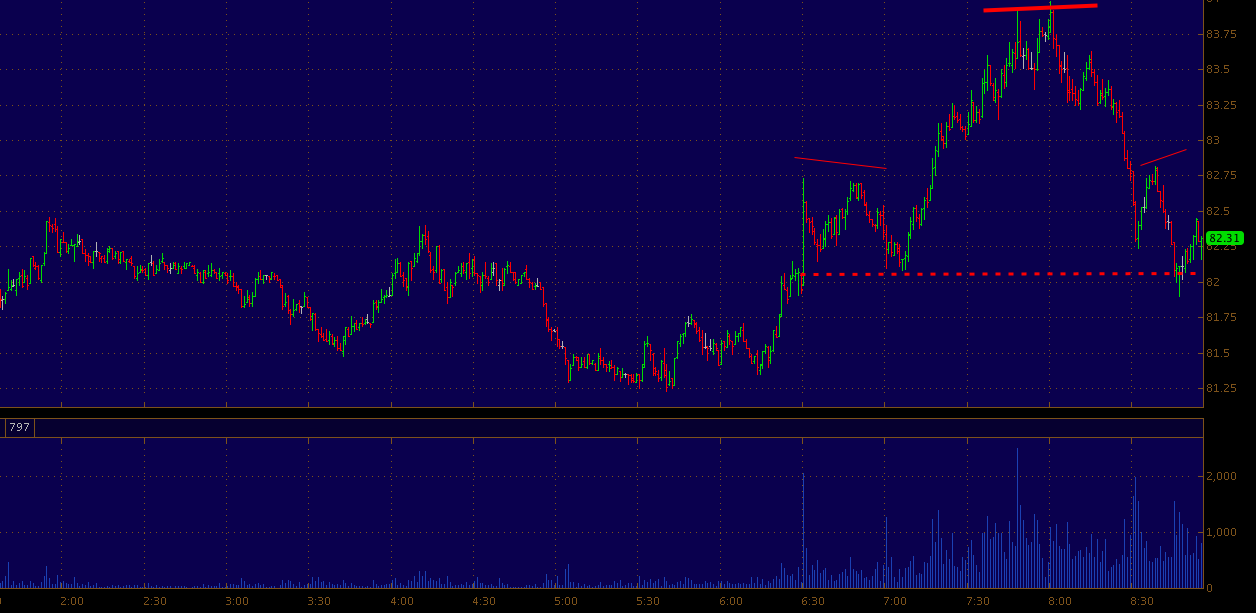
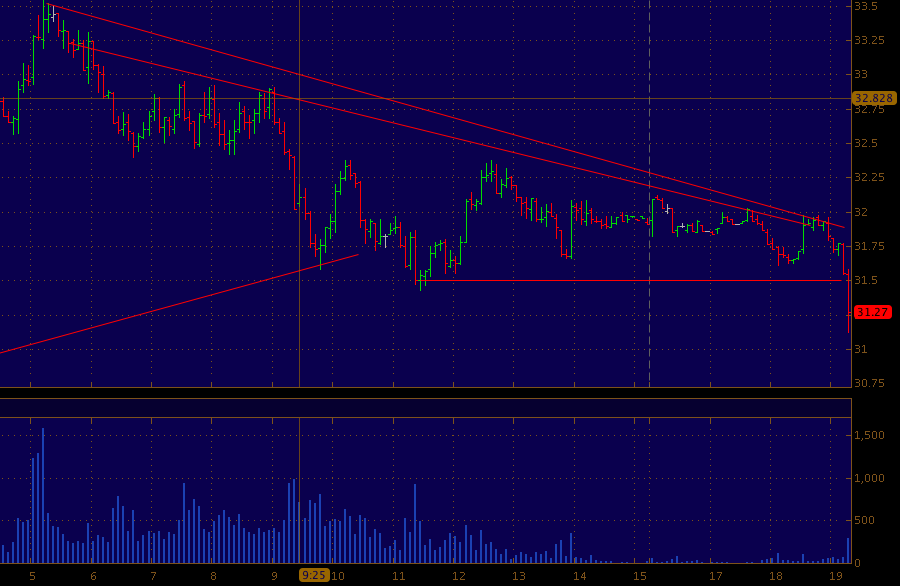
Crude has moved from 81.25 to 83.52 in about an hour so thats normal ya know, with all these huge changes in the supply/demand curves on a minute to minute basis.

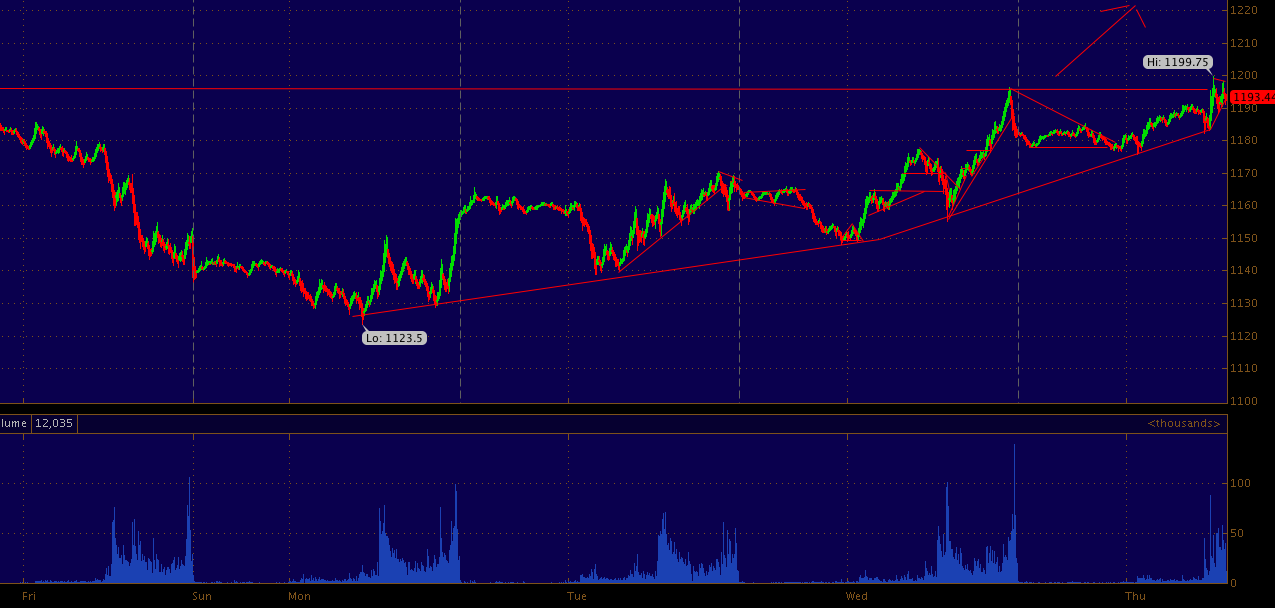
Over 1168 we could see buy stops up to 1180 or 1185. Those levels fails we could trade back to 1160. pick your spots..

Wednesday, September 28, 2011

5min Silver Chart For Wednesday (SLV)

the 29.50 area breached to the downside . looks like the falling wedge is still in play...
SI 5 min

Another Bat In the S&P500 Has Been Captured - Bat Wing Formation (SPY)

The bat wing formation worked again... the highest level of the left wing was 1175.. where did the ES stop after 1175 failed? 1145.. .. Ill trade the bat wing anytime i can for 30 handles.
1 Min ES_F

Late Night S&P500 Chart Update

bounce off 1162.75s ES 1 min .. 

Tuesday, September 27, 2011

Silver Future Chart For this Evening (SLV)

5 min

31.50 found a seller.

Post Last Hour Sell Off S&P500 Charts (SPX)

15 min ES
the break of 1185 was a definitive short signal .. similar to last wednesdays closing hour price action. 1158 is the support i am looking at... below could be a quick trigger down to 1150.

Place This Chart In Your Short Squeeze Pattern bank (SPY)

and the break .. triggered sell stops under this trend...
5min

Silver Trend Update - Monday Morning Drop Never Happend (SLV)

Heavy over 31
5 min

43 Hours & 70 S&P500 Points later Here We Are (SPY)

Over the 1160 level sure did find some buy stops.. the index sailed with its sails full of wind up to 1187.25 before either a. machines ran out of fuel or b. a human traded.
15 min 

Late Night S&P Futures Update (SPY)

everything is up. all you need to know. carry on..
15min

Monday, September 26, 2011

Late Day S&P500 Chart Update

5 min ES 

Large Crude Oil Range This Morning (USO)

Very similar to friday morning.. the two periods i am referring to are highlighted below -
5 min crude futures

Silver Futures Down Over 10 Percent (SLV)

getting interesting.. i first mentioned a potential short opp in silver under 29 . 9% ago .
5 min SI

Sunday, September 25, 2011

Hi-O Silver - A Daily Look At Silver (SLV)

Daily with 5 min inset

Friday, September 23, 2011

Back in The Channel Again - 21% Gold Margin Hike (GLD)

GOLD daily.. and 30 min inset - notice the price fell straight down to the lower up-trending line 1635ish. this trend was last test in mid july.. only to recover.
At first those on the street thought Paulson was liquidating his gold fund... but the truth comes out - CME hiked gold margins 21% this evening.

. Someone got wind say... 70 GC points ago? Guess the CME needs to figure out who is leaking their oil because the crank case is gonna burn the hell up.

Thursday, September 22, 2011

Taking a Step Back

stay tuned.

Late Day Correlation Update (SPY)

Patience... said the HF trading machine.. take a look at the lines..all very different companies/products.. but identical trends when axis's are aligned.
CL ES AAPL BAC

Apple & Crude Oil Correlations (USO)

interesting indeed.. Crude and Apple Above.. ES_F and Apple

S&P500 & Apple Trading in line today. (AAPL)

Why trade the ES_F when you can trade apple ? or v. versa
ES_F vs. Apple 

Tuesday, September 20, 2011

Late Day Gold Update - Failing Descending triangle (GLD)

Support held @ 1180 resistance held @ 1810. Over 1810 could see buyers, under 1800 more sellers. Gold tend to work itself into tight formations post a large move and pre a large move. 
GC 1 min


Late Day S&P500/Apple Correlation Update (AAPL)

1 min CL ES APPLE GC 
After apple put in another morning of new high pulling the index's and Oil with it.. yes oil. You can see in the chart to the left crude has a very strong correlation to the S&P500 thus it will have a strong correlation to Apple computers because apple computers is a huge component and machines are all on the same team.

Crude under 86 this early morning to over 87.70 as apple topped out @ 422.86. From this point on the market melted lower as the dollar firmed up and Gold quieted down over 1800 but under 1810. I still feel over 1811 GC will see quiet a pop, sustained? i am not sure but seems to be pent up potential energy under 1810.

As for the ES_F we came in down substantially after the Italy downgrade rallied through the early morning hours during china and asia then took out all the sell stops under 1200 before it rallied all the way back to 1214.5. this HI coincided with APPLE's new all time high. 1200 is physiological level thus im sure it will be on our charts for some time.

SINA is loose.

SINA Fell out of Bed as well as Baidu (BIDU)

SINA 1 min.. no fresh news...

Today's Correlation Du Jour - Crude Oil & Gold (GLD)

pre fomc moves.. and CHINA rumor of stepping up buying of physical .
CL 1 min GC 1min

Monday, September 19, 2011

Monday Evening Post Italy Downgrade Emini Chart (SPX)

You can see the pretty tame candle from 1197.75 down to 1185.25 as the Italy downgrade news hit the wires... We are following the same lines which were in play during the regular session.

1190 is (was)a sticky area with 1195 being an overhead level of resistance. over this level 1200 in cards.. below 1186ish could bring in some sell stop probing... long night ahead..

Crude played games today and really did not lead the market anywhere during regular session today, though tonight crude is remaning strong around the 86 level.. mean reversion, crude's price always seems to meet in the middle of the day's range.  Which is roughly 86. Gold hanging tough over 1780 level.. which was a level where there was quite a fight in the regular session.. above bullish .. below bearish.. gold moves in spikes remember.. the dollar gap up again has the same feel as sunday evening.. 

Married

Cl & AAPL

Crude Oil 1 Min Chart for Today (USO)

Apex reached .. failing downside

A Look At Apple Computers Chart Today (AAPL)

IPhone 5 rumors check. China Iphone 4+ check. Panel TV check. All of this known before today. check. Stock up 15 points from lows in an hour as these above items circulate? Someone front ran these above items check.
1 min

Gold Falls Out Of Bed In A Flash (GLD)

Gold weakness is still  an issue into the afternoon trade.. consolidation above support of 1780 is something of concern for gold longs... dollar strength coupled with Obama's jobs plan has profiting taking front and center... a break of 1780 could send gold into a sell stop cascade.
1 min GC

Friday, September 16, 2011

Today's CMZ - UBS 2 Billion Rouge Trade Explained (SPY)

via @optionmonster


S&P500 Futures Trend Today Is Interesting (SPY)

last half hour of each day highlighted in red.
5min.

Thursday, September 15, 2011

Research In Motion Misses Earnings (RIMM)

hey hey hey.. goodbye.. you could see this coming a mile away..


Research in Motion reports Q2 adjusted EPS 80c vs. 87c
Reports Q2 revenue $4.20B vs. consensus $4.47B


Research in Motion sees Q3 adjusted EPS $1.20-$1.40 vs. consensus $1.36
Sees Q3 revenue $5.3B-$5.6B vs. consensus $5.27B. Sees Q3 gross margin approximately 

THE BAT is BACK - S&P500 on the Cusp - (SPY)

Are the Index's about the fly away or fall into a pile of guano ?
1hr ES_F

A High Frequency Trading Relic in Action (NFLX)

1min... glad that algo took out the stops over 180 before it fell to 169.. hell of a trade.
The stock is about to break down.. Algo realizes a big ticket is coming ... they run the price of NFLX back up to over 180 then take it down to 178.29... you can see below.

A 5 Minute Look At The S&P500 Futures (SPX)

same lines different day different break out. 1200 here we come... maybe we see 1220 today... or will reality set in after this 4 day bender of buying? 1190 is a support level that is key, below we could see 1180 quick, god forbid........ When the fed is in charge there are no hangovers. Philly Fed came in negative.. BUT of course it has a positive spin..

"The latest Philly Fed index came in a little worse than economists expected, but not as bad as its awful reading in August" - WSJ 
5 min ES_F

Netflix Lowers Subscriber Outlook - (NFLX)

No surprise here...but what does that matter the market is up for the 4th day in a row.. Europe is saved.. buy everything.
()The company, which separated its streaming and DVD-by-mail services two months ago, said Thursday it now expects 21.8 million subscribers for its streaming-only service and 14.2 million subscribers to get DVD plans. That's down from a late July estimate of 22 million streaming customers and 15 million DVD subscribers. It sees the most subscriber decline in DVD-only plans. That forecast went to 2.2 million from 3 million.
30 min ES

Wednesday, September 14, 2011

Two Different Products One Identical chart - (SPY)


Unnatural Chart Award (AAPL)

1 min

APPLE inverse Head & Shoulders (AAPL)

S&P500 Breaks Intra Day Support - Broken Bat Wing (SPY)

1170 broke 1165 broke 1160 broke in succession.. AFTER the insex melted up from 1150 to 1177.. line em up to knock the down.. profit from this. look for hard line support at 1150 if we get there...
1 min bat wing. 

Tuesday, September 13, 2011

Correlated Megaphone (GLD)

Newer Posts Older Posts Home