Tuesday, January 31, 2012

Crude Fails 98 only to regain. though down from 101.29

Huge range.. The bat has done some damage.
5 min 

Mid Day Light Sweet Crude Chart

5 min 
Quite the reversal as you can see from 101.29 down to nearly 99.25 which imo is the lower line in the sand.. below .25     . 99 will surely trade..

Worth noting the volume in the 5 minute period where crude failed 99.75 down to the 98.80 area over 13k contracts trades. Fairly high volume and above average going back a few weeks.

10 year look at Radio Shack (RSH)

10 years of disappointment and margin erosion by the big box competition has done a number on RSH share price... below 7 bucks this thing could see 5 and lower.. in the past 3 years there has been quite a bit of 'rumor' about a takeover or private equity in this name, nothing has materialized but lower prices.
monthly RSH 

Monday Morning S&P500 note

5 min ES... post PMI sell off.. 
5 min ES
1318 and over could bring in buyers into 1325as over this lever last week caused a frenzy on the upside. I am no more a bull or bear than anyone but you gotta trade this market in the direction it moves or perhaps wants to move.

on the downside 1310 is immediate support. below we are back to yesterdays territory. 1305

CL bid over 101.39 .. 101.29 is the day high...

remember.. today is the last day of January.. window dressing perhaps..

Friday, January 27, 2012

Cash Closing print reaction in the S&P Futures

just another day at work.
1 min

Weekly, Daily & 4hr S&P500 Chart -

4hr ES .. NOTICE volume. quite low.. still declining steadily...
Weekly ES. 
Daily ES

1309.75 "pinch" - Afternoon S&P Note

I am very disinterested in the current market; recycled headlines et al. Anyway the S&P future contract saw rising prices throughout the morning; from 12 am or so until cash open... and again after cash open (almost identical to yesterday); the price sold off 10 handles.. from 1317's to 1307. The overnight low broke without hesitation, yesterday's lows below 1305 were not tested.....  Thus making 1307 the line sand
5 min ES


Thursday, January 26, 2012

Last hour S&P500 Future Update

5 min ES
the low today 1311.50-1312.50 coincides with Monday's closing resistance and right shoulder of H&S which took the ES down into cash open for tuesday which was the 1301.25 test.

very slow slide today.. lots of panic for only a -.6% day.. but remember we did gap up nearly .5% .. we are down 18 handles now from highs.

Interesting Bullish VIX activity under 18..

weird prints..
5min VIX

Quick S&P500 Chart update

5 min ES
As you can see we rushed into new 2012 highs .75 from 1325 post cash open though the new highs were faded very quickly. i 5 handles before 1329.75 traded. i did not think the trade would come as ... perhaps this is the case as CL GC 6E and ES all came off their highs together. A correlated market on upside is an even more correlated market on the downside.

1320 broke.. if 1319 fails.. 1315 and we languish most of the afternoon until the close IMO.

Thusday Morning S&P Futures Note

5 min ES
Another day another new 2012 high.. this time we took out 1325 and traded 1327.

1320 is lower line in sand for support off the open.

Crude up 1.5% to over 101

Gold up over 1.3% to 1722.3

Euro up half a percent to 1.3168

Jobless claims spike to 377k for last week..

Wednesday, January 25, 2012

Wednesday Evening S&P500 Note - Chart

5 min ES
Note from this afternoon. 

Post FOMC S&P500 Note -

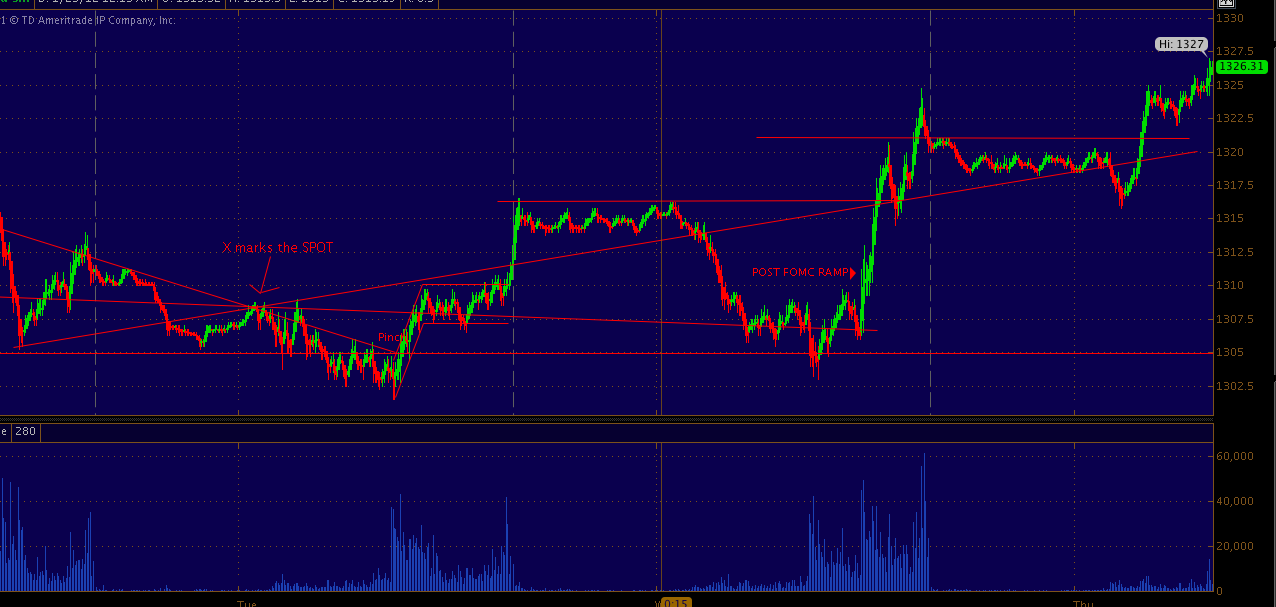
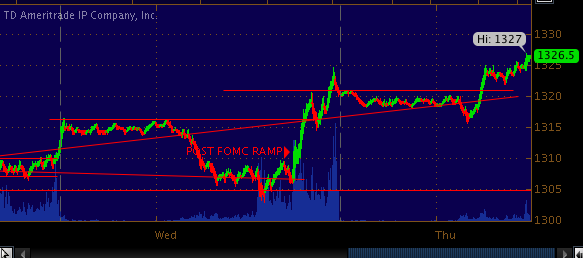
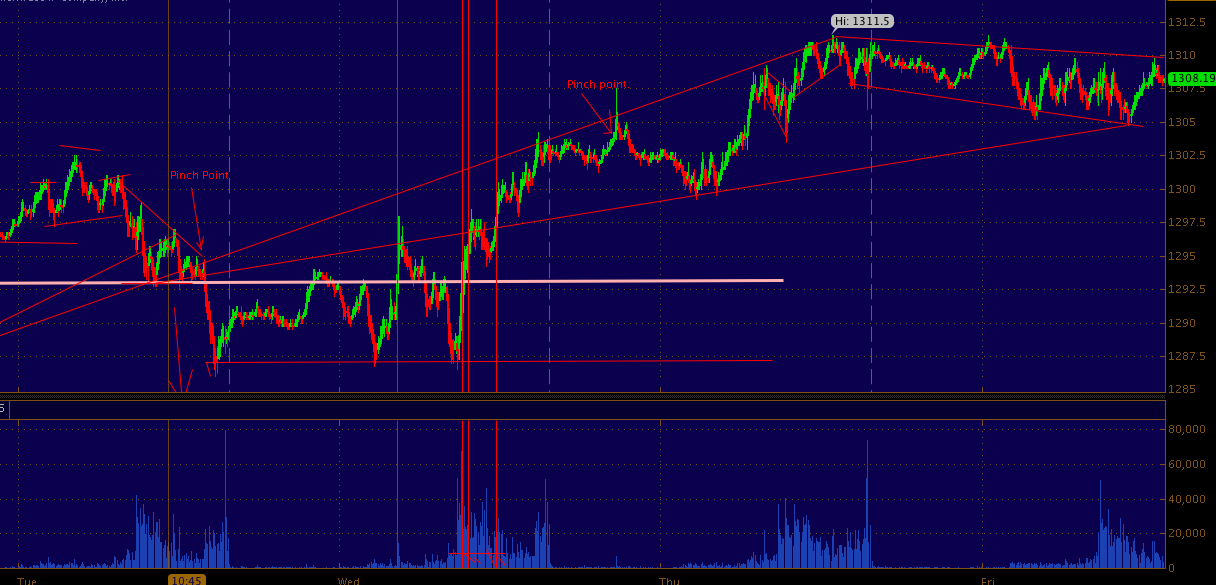
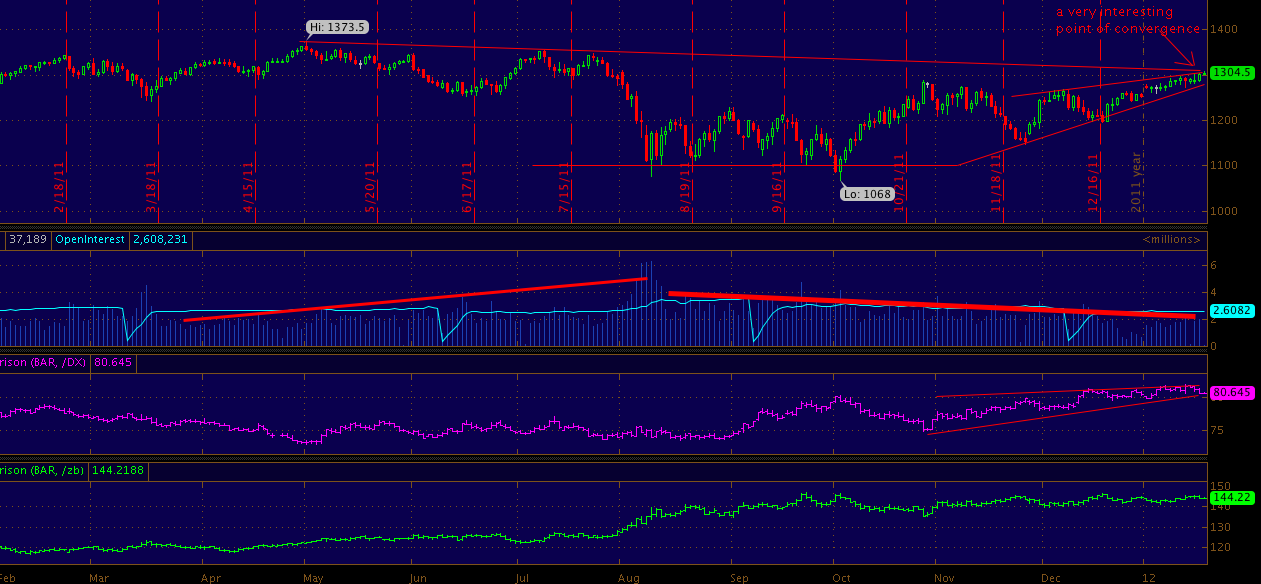
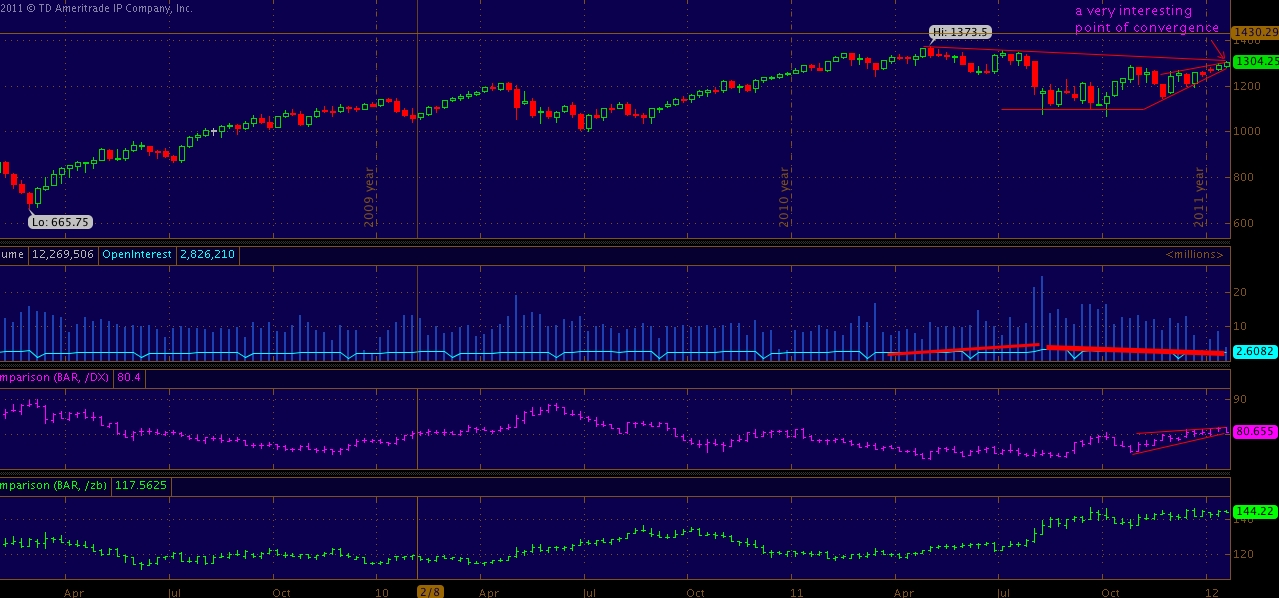
Updated S&P chart below.....
1325 reached . 1327.5 traded 1/26/12
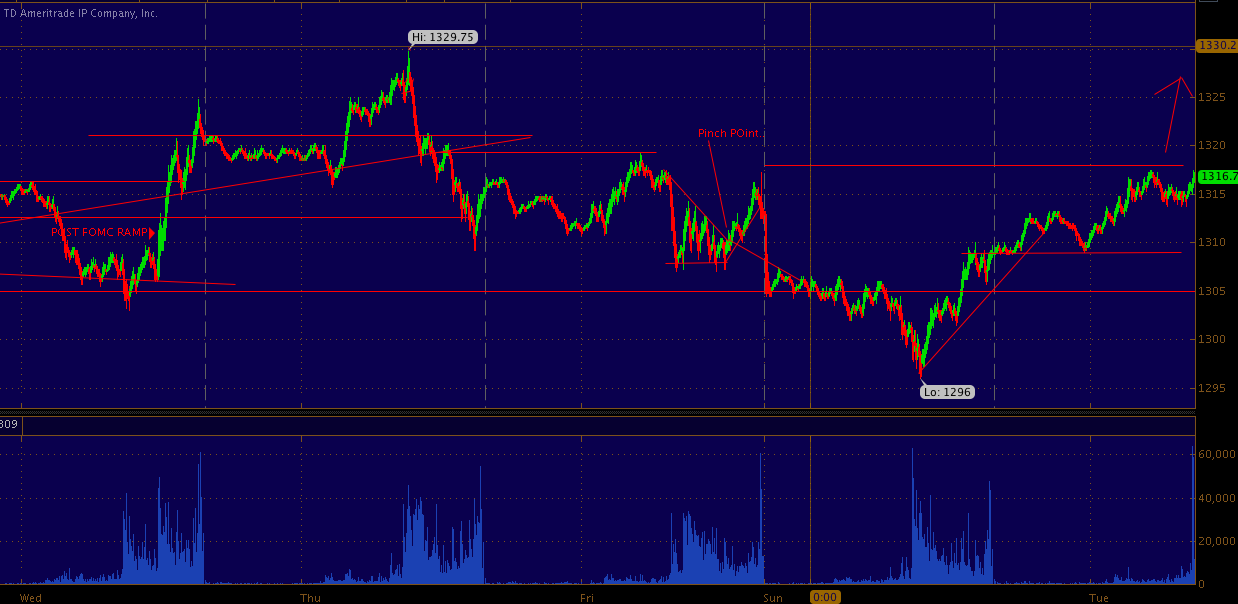
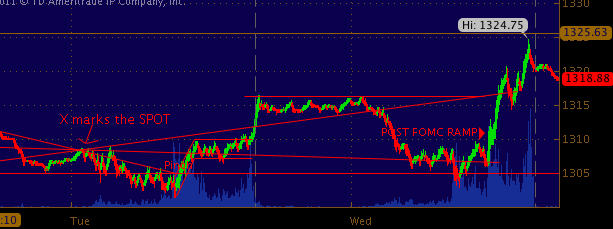
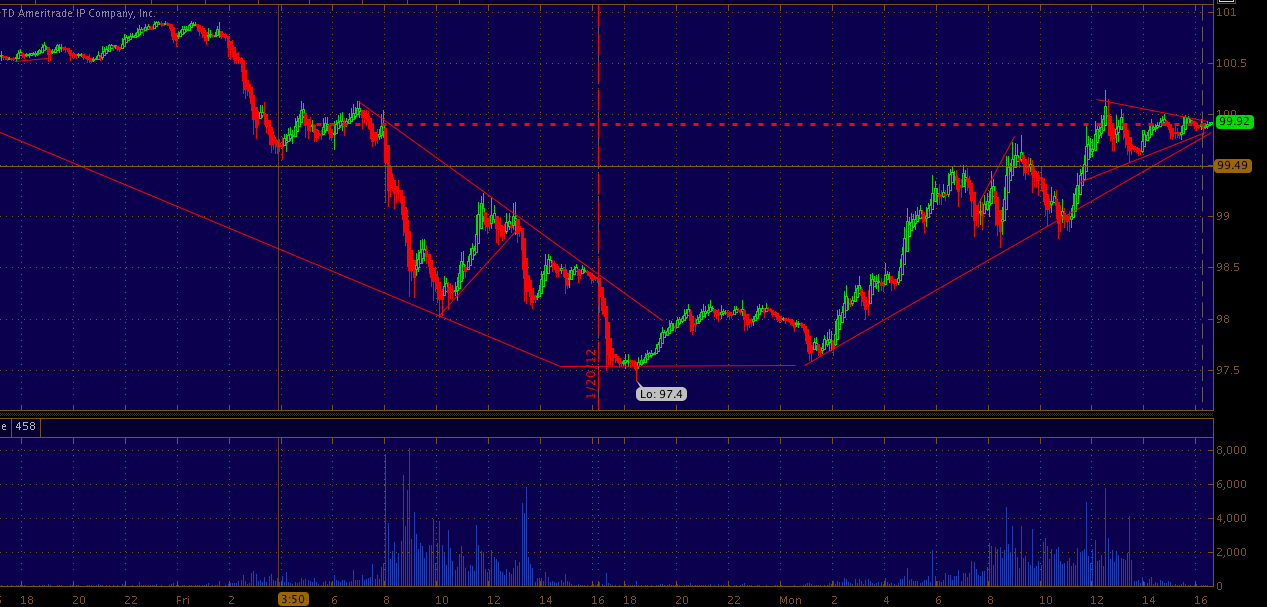
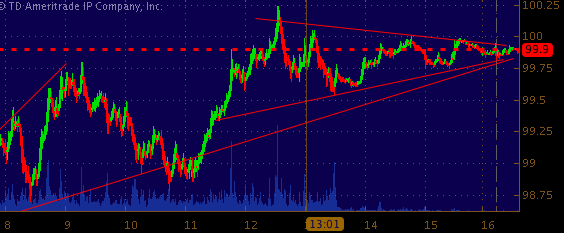
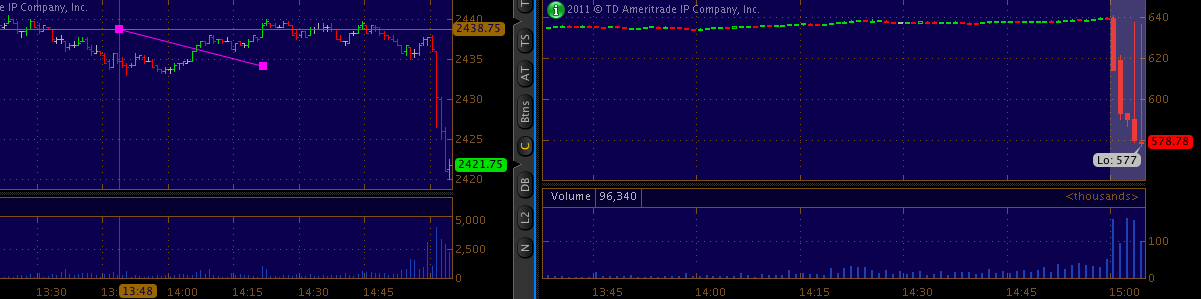
5 min ES . notice how many trend lines are still dictating pivots
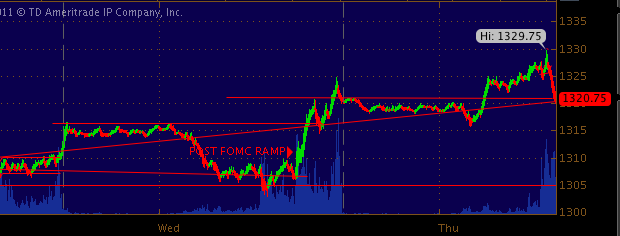
Good afternoon trend riders... Another day & another new 2012 high of 1320.75. Today the catalyst was the FOMC which as soon as they dropped their 'knowledge' the market lurched higher as if the Bernank had just perfected fusion...

The centrally planned and centrally controlled market will only go in one direction, without QE UP.... because apparently all the market needs to move higher is synthetic ETF QE administered via individual stock arbitrage creating what looks like buyers and sellers.. when in reality it is a game of hot potato between HF programs..

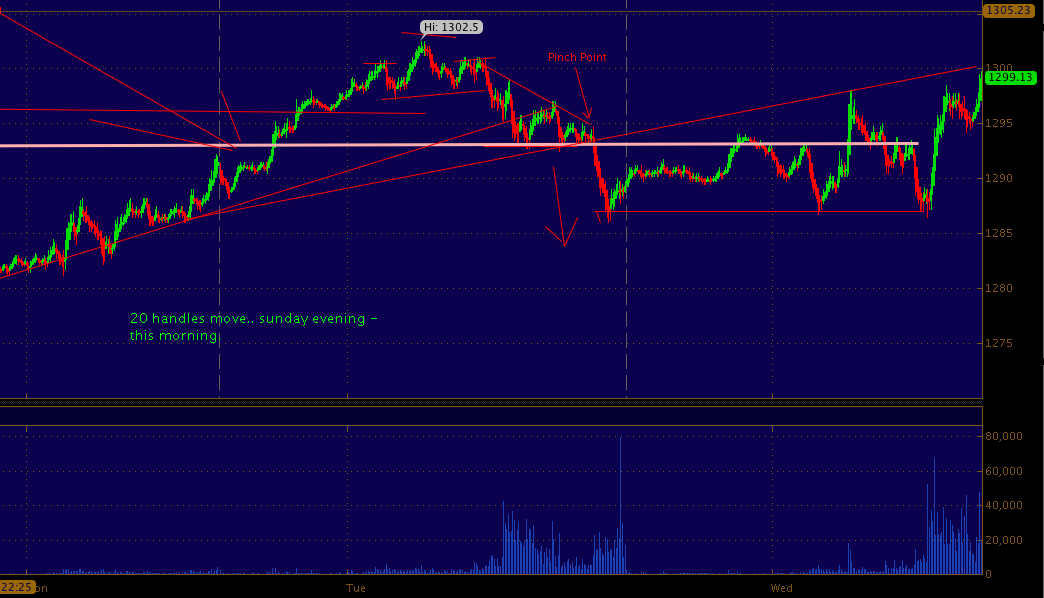
Anyway, from the 5 min chart above you can see the violence of the moves during cash sessions, including today's buying frenzy. Monday and tuesday the futures looked curiously weak until around 5 am in the morning when the machines stepped in taking prices vertical.

What makes this morning's trade different was we had weak equity futures from Asia open until about 15 minutes after CASH opened, then buyers stepped in around 1302  melting the price higher into FOMC.. once FOMC hit futures lifted from 1308 until 1320.75.. simple right.. WE could easily see 1325 if the momentum continues. Looking like by march we will be clear above 2011 highs...
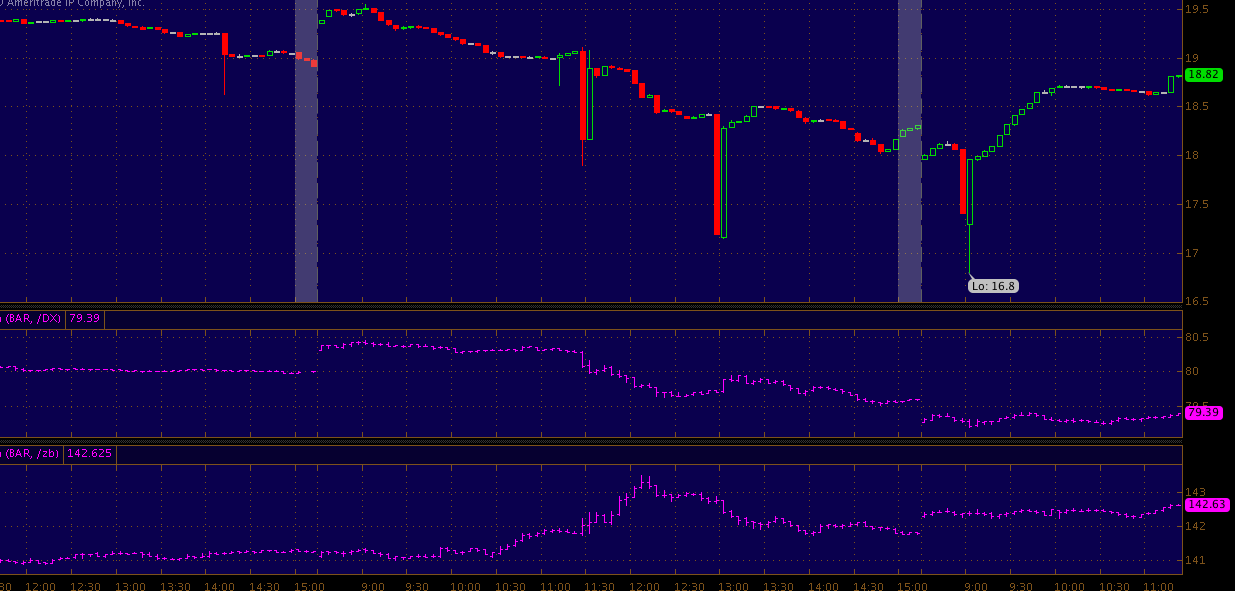
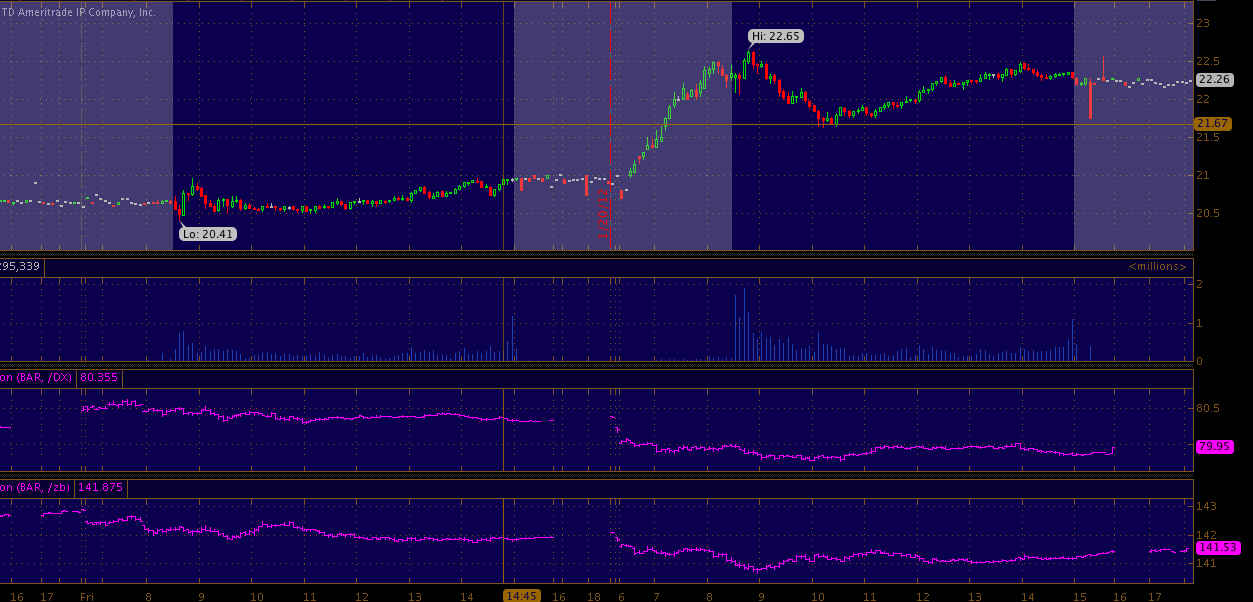
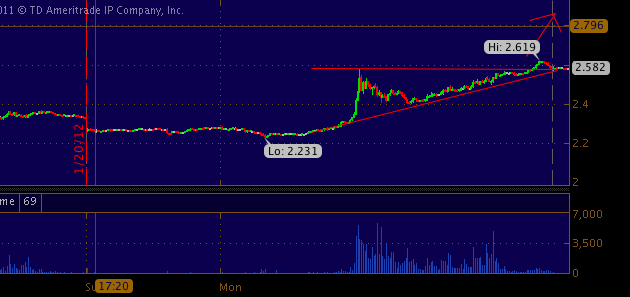
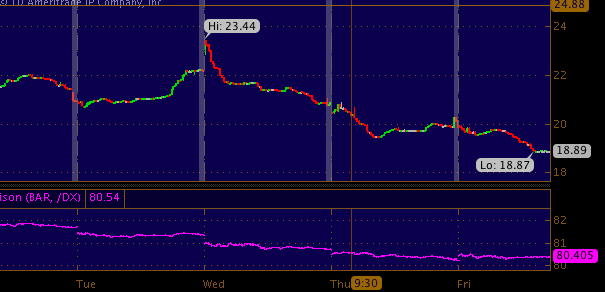
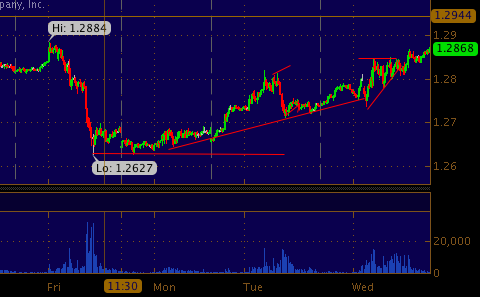
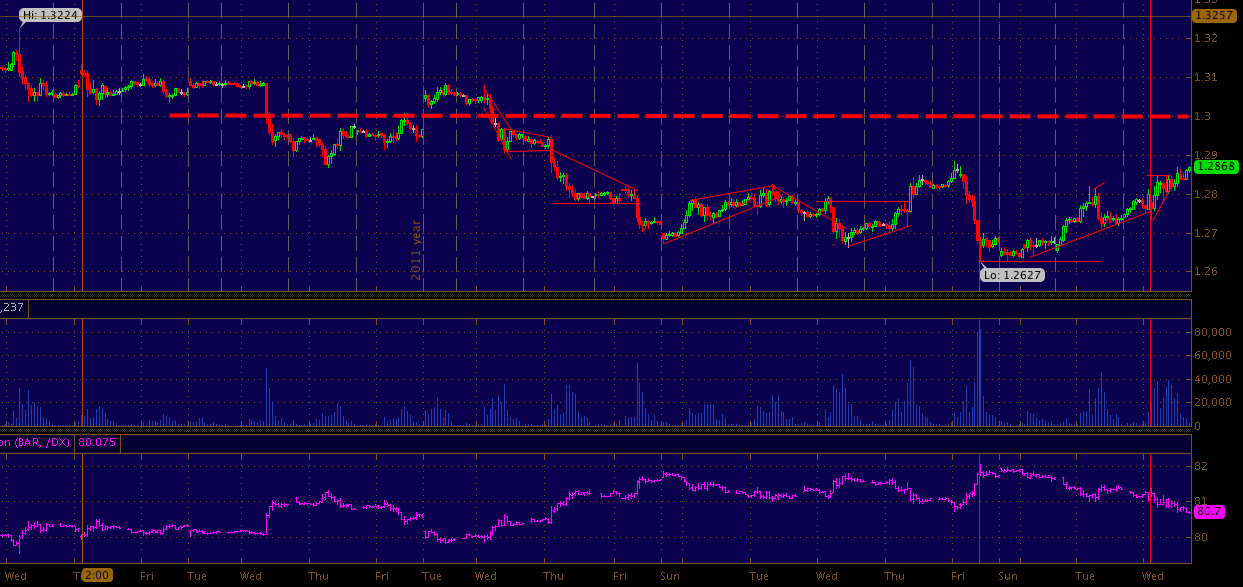
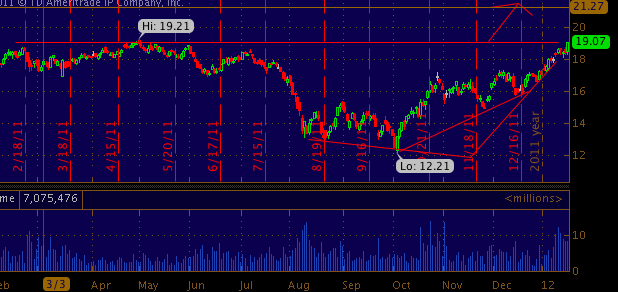
example of ETF correlation ...FXE and EDC .. exact same chart.. 
Remember apple carried the nasdaq into 11 year highs today while google sold off 11 points...

Trade what you see and not what you think.

Tuesday, January 24, 2012

10 year Nasdaq highs on 5 year volume lows (AAPL)

monthly NQ 
2458.5... thanks AAPL... and china for your help in producing enough Iphones cheap enough to propel apple into all time highs carrying our index's into 10 year highs.. We will continue sending our jobs and technology your way.

Post Close S&P's Chart -

blah blah blah
5 min .. 
cash close pushed the index's into a session high of 1311. blah blah blah
and next.. u have NDX futures..

largest 5 min move all day... in the final minutes of the session..
5 min NQ

The Auto Pilot Market - Afternoon S&P Futures Note

Lets hope the GPS driving today's trade is not one used on cruise ships... or actually yes.. that would be good.
5 min ES 
no test of highs today, yet.. though the perma bid over 1305 still exists and you can lean on it carefully if you choose to scalp long. You can see where the price pinched as cash markets opened @ precisely 1305.

Over 1310 buy stops.. below 1305 we see 1301 again.. last week i mentioned i welcomed a test of 1300 before we moved higher, if indeed this is the trend... the low today 1301.75 just might have been the test of 1300. If that is the case 1320 in the deck later this week.. if the market will ever wake up again.

Monday, January 23, 2012

Chesapeake Cuts Production. Will other producers follow suit? - Rig count (CHK)

5 min CHK 
Natural gas futures awoke today from a declining vegetative state with CHK throwing the valves the left on 9% of their US dry gas production essentially shutting in 0.5bcf/d dry gas and up to 1bcf/d by by Q2 2012........ this announcement caused a violent spike in NG futures.

The price throughout the day rose from from 2.31 to 2.619 and the (semi) popular ETF UNG up some 9% ....

According to Tudor Pickering: "Significant gas activity declines are necessary for improvement in supply fundamentals and view reductions (-163 rigs since Oct high) as step in right direction."

As you may or may not know the price of natural gas futures are down substantially since they last saw a sharp spike in 2008. The drop in price can be explained in simple supply and demand terms....  greater and greater capacity has come into the market as shale gas and liquefied nat gas production has boomed while demand has remained constant...... this is the driving force behind pushing prices lower and lower.
1 min NG futures.. more upside into 3.20 if this triangle holds

The million dollar question is will Chesapeake's competitors follow suit with production cuts or will CHK remain on it's own. IF other major US producers follow suit you can surely bet on much upside in nat gas prices, especially if last portion of winter and spring is cold.

More longer term speaking..upside in a Nat gas prices can be bolstered if current US energy policy rhetoric hints at utilizing our vast reserves of nat gas...or more cuts cuts...

If i remember right i tweeted a few weeks ago.. "we have a lot of nat gas, its time to start using it" - time to start thinking about the above paragraph becoming a reality.


There is so much gas they are shutting in production.. wake up washington.


Light Sweet Nearing Pinch Point @ 99.95 (USO)

5 min
Crude has trended higher into a consolidation pattern in and around 100 since the 98.60's found a bid in the wee hours of the morning.... remember 100 is a rather sticky area.. politically fundamentally & technically speaking.

two things can happen..

A. CL will break out of the formation over 100 and melt up into the evening hours...

B. 99.80 fails and we see a test of 99.50

1 min CL

Monday Morning S&P500 note

1318.25 traded on a reach into buy stops and failed violently down to 1305.25 ... refer to my morning post from 6am below. 
5min ES.. 
5 in ES
If you went to bed at a reasonable hour you saw red futures, this (anomaly) did not last long... the ES is currently green as well as crude. Some eurozone talks on the 'crisis' apparently sparked the algo's into buying over 1310 sending the ES up to 1314, a new 2012 high!  1305 held firm throughout the night thus during cash and the hour leading up 1305 will need to hold to continue upside. below could trigger 1300 test.


The euro is up .6% sitting with the high of the session being 1.3017... as you remember a big break down point for the euro was 1.3 failure..

Friday, January 20, 2012

January OPEX S&P500 Futures Note

5 min ES
We have failed to break over yesterdays high of 1311.5 though 1311 did see a few test in the early morning hours as asia and europe duked it out. As for OPEX most stocks are flat or at max pain. There is a few individual momo stocks such as CREE which are moving though the big board names are not playing nice in the eyes of traders today looking for some vol. I guess GOOG really spoiled the party last night... 

the line in the sane for today in the ES is 1305, you can see how the uptrending support line from two days ago converges with today's support. If the channeling pattern which indeed is sloping downwards continues 1305 could fail. I welcome a re test of 1300, but i welcome anything today to shock the markets into moving... 

VIX below 19 .
5min CL 
VIX 5 min 

Thursday, January 19, 2012

GOOGLE misses EPS - pulls NDX down

s
NQ and GOOG 1 min 
goog down 70 points AH from 640

Sonar Report: VIX Vega Trade (VXX)

Crude Trend Compared to Yesterday Very similar

Worth noting.. notice how the high for the day in CL was put in around 8 am EST.. yesterday right before.. today right after.. both today and yesterday CL sold off into lows after 101 failed. then bounces around 1pm.
5 min CL

Morning S&P500 Futures Chart

Another day, another year high. 1309.25 this time... anyway the overnight session was the one to trade, cash opened crude puked, ES puked rallied, then puked. all in a 5 handle range. Makes you wanna pull you hair out. but whatever.. maybe we will have a red day? god forbid the market falls a percent.
5 min ES>. still following the resistance

Wednesday, January 18, 2012

New Year Highs in the S&P500 reached 1307.5 (SPX)

Daily 
Monthly


Good evening - 4 levels lifted up to 1303.75 as highs of the day were breached. little over 6800 contracts traded in the 1 min period of the break out.
5 min ES 

Crude Oil Futures open HIgher this evening USO

So far .60 holding.. coiled for a move into 102 and beyond..
1  min Feb CL
 posted on twittermachine 3 hours ago a pinch lining up.

Deal or no Deal - Euro Continues the march towards 1.3 crime scene

5 min euro dollar futures
IF i had a trillion dollars... Id be rich.
1 hour euro dollar futures 

Guess this Chart - (XHB)

Daily XHB .. another 9 cent over the breakout opportunity i highlighted in the below chart 
Answer is - XHB - home builders SPDR
daily 

Needle Spikes of Buying within Broadening pattern (SPY)

ES Higher highs within the below pattern.. lows held.. bullish yes.. though will the S&Ps fall off 1300 down to 1286.50 (morning support) or test the mid line of the channel 1293? we shall see.... when europe is closed the market behaves a bit more rationally.
5 min ES 

NOtice the red vertical time markers.. each marker coincides with a violent spike in buying..

followed by a drop in volume and a drop in price.. it does makes sense here..

more buyers than sellers..but what is funny is how large the volume spikes
are compares to average 1 min volume excluding the large vol spikes...

Germany Downgraded S&P500 Soars!!!!

Euro HI. all problems solved. 
5 min ES
notice the broadening pattern.. higher highs.. but low holding 1286.50 

Wednesday Morning S&P500 Look

5 min ES. showing 1287.50 support below will see quick selling into 1285.. that fails.. 1280.. Euro strong like bull over 1.28
15 min CL 
CL on its own again.. but showing up with weakness a bit later then equities though.. equity futures became weak around 5 am.. CL sold off front its high of over 102 only about an hour ago.

below 100.50 CL could again run to below 100..  if it holds we chop around into new highs..

Tuesday, January 17, 2012

A Monthly Look at Cree inc. (CREE)

CURRENT - Monthly CREE
Monthly interval CREE
Buying opportunity or has this goose been cooked?  Based on previous 9 year trend.... It would not be a bad bet to take a look at this stock as a long idea around 20 a share.. under 20 could mean the price may see 15 quick, again based on prior trend & price action.

Oil Wants 101.01. officially 45 hours of buying. 2 hours of selling

CL 15 min candles.. Far left is SUNDAY open.. far right is current price. 

Newer Posts Older Posts Home