Thursday, May 31, 2012

Chesapeake Energy Chart

4 hour - CHK
The 16 level held firm this week..&  today the move off 16 has been very convicting into the 17 level.. over 17 could convert into a test of 18.75.

If patient a buying opp off the 15.50 to 16 would be a more ideal if not trying to chase.. though 17 may convert into support after today..

15 min CHK
weekly CHK 


Tuesday, May 29, 2012

Weekly spot gold chart annotations updated

.... 1525?
weekly GC 

Euro on ledge into the Abyss sub 1.2462

#weaksauce under 1.2462 ... 1.24 easy
weekly 6E
5 min 6E
1 hour 6E


Friday, May 25, 2012

Last 5 Spoo sessions nearly identical price action

see for yourself... 1235
5 min ES 

5 minute look at the Spooz

same pattern for 3 day/nights now - Euro just shit bed into year lows of 1.2507.. perfect timing to cause a vol spike ahead of US equity open.. anyone else sick and fucking tired of hearing about Europe's problems?

5 min ES

Wednesday, May 23, 2012

5 Minute look at the $SPX -

The 5min SPX signal lowered the trigger price from last nights post of 1319.(bottom chart). to 1315 as this mornings selling pulled some weight into the line... though same game.. the trigger was tripped and index jumped 5 handles.. it took quite a bit of buying to push price through signal post divergence.. powerful move..

 support resides at 1312.71 into AM.. ES support 1308- 1 min sell signal.. 1310 should be defended though...

5 min SPX
Add caption

Tuesday, May 22, 2012

6 Day look at the SPX -

S&P500 future 5 min - mini 
mixed signals... can you decipher?

SPX - 5 min - buy signal over 1319 -

1 hour look at West Texas Intermediate

The pressure is still on (crude) in my 13 cent opinion... today's little euro puke into the cash close was foreshadowed by weakness (divergence from equities) in crude and copper. Crude ended the day down in excess of 1.2 percent as equities smashed their gains in the final 45 minutes

.. market is finicky as it can get.

my take on oil is if we break the Sunday evening lows of 91.12 after (IF) support @ 91.50 gives way, the 90 handle will be on deck.

on the upside a break of and hold @ the 93.33-40 could trigger a move into 94 - 95 if momo is at the back...
1 hour CL 
4 hour CL

Friday, May 18, 2012

The Opening Facebook IPO prints

delayed 15 minutes.. algo's going nuts ahead of the IPO.. someone is worried about this..

SO far not so good..

FB

Anteater formation in crude ...

careful.
5 min
Trade for Prof.it

Thursday, May 17, 2012

The Nasdaq 100 is lower by 227 points..

in 1.5 months... 2500 clearly the next stop.. then 2400...
daily NQ

Tuesday, May 15, 2012

Crude down sharply this evening.. lets take a look

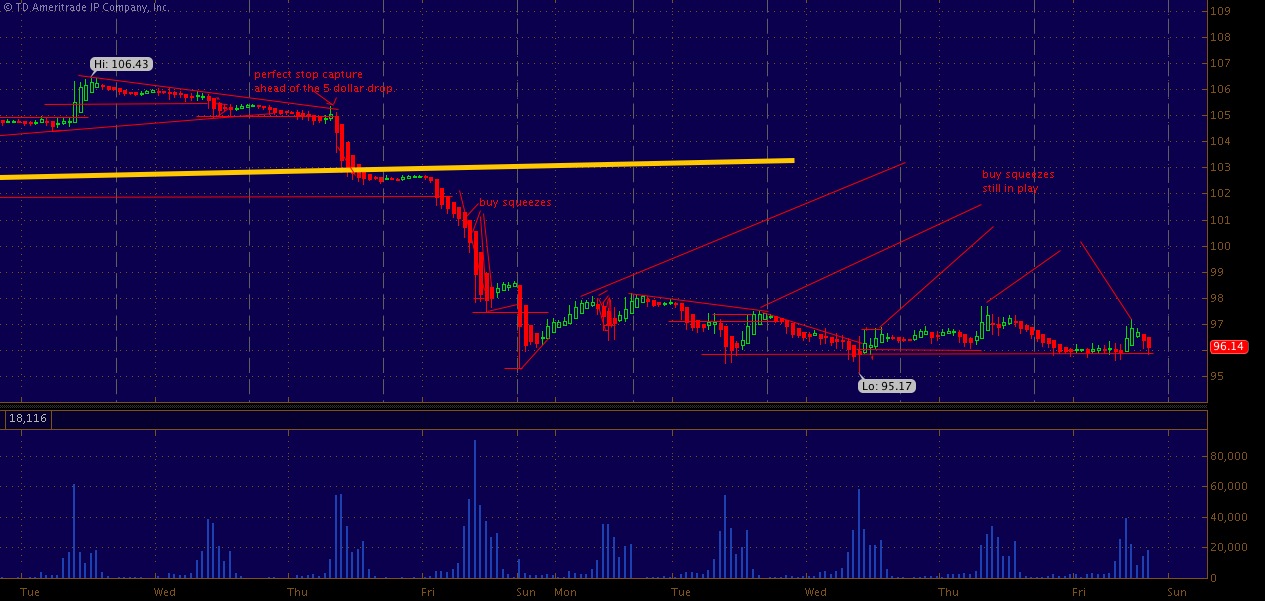
Crude continues to crush itself after failing a clear uptrend at the 105 level just under two weeks ago. Tonight crude has traded into 92.60 despite the dollar and euro remaining quiet after their Tuesday afternoon antics.

What is startling about crude's current price action is the fact the percentage losses are not slowing up as as prices continue to decline with zero notable bounces.... We all (should) know the lower the price falls in crude (or any asset) the smaller the dollar amount equates to a %. What i am saying is declines of a dollar are going to become larger and larger percentages, accelerating margin calls and the rolling up of positions in a nut shell... im thinking risk slides...

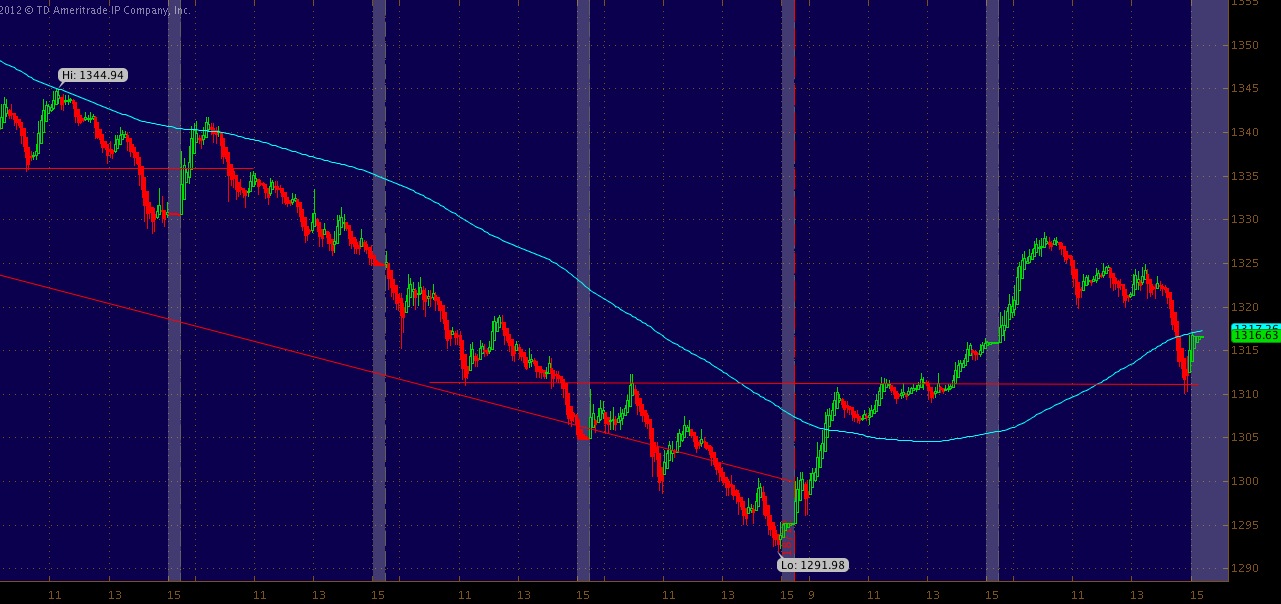
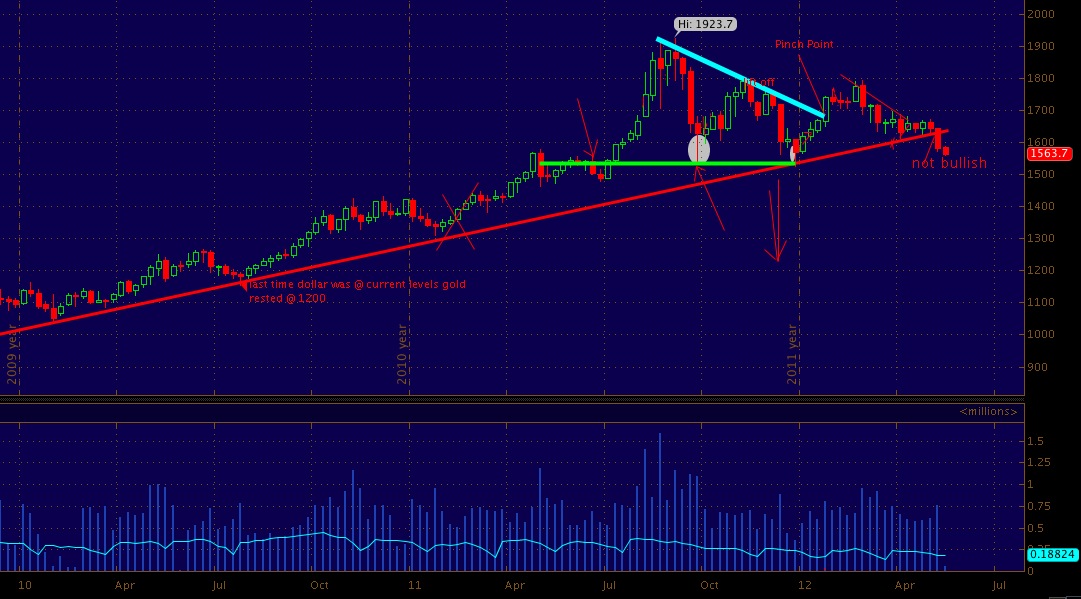
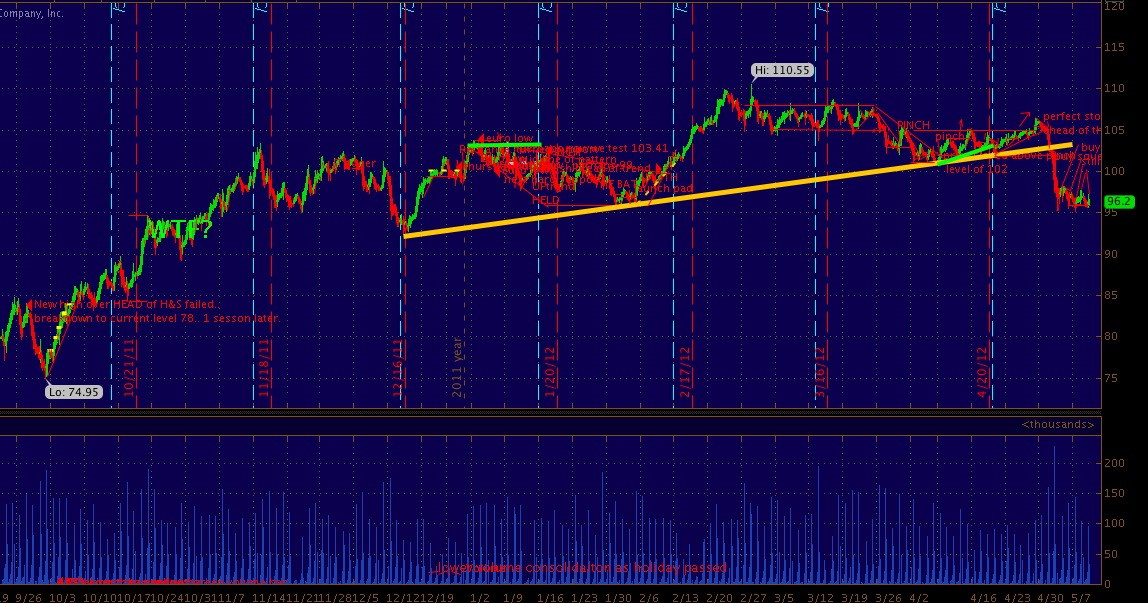
I am looking to the 92.50 level tonight, if this level were to fail 92 on the deck... if this is to fail 90 on deck.. then 87.. 85 .. then euro crisis low of 74.95. If this were to happen you can bet the DX will be at 83-85 and ES 1200-1250 area.

ON the flip side.. if 92.50-60 holds a re test of the 93 scene of crime would not be out of question.

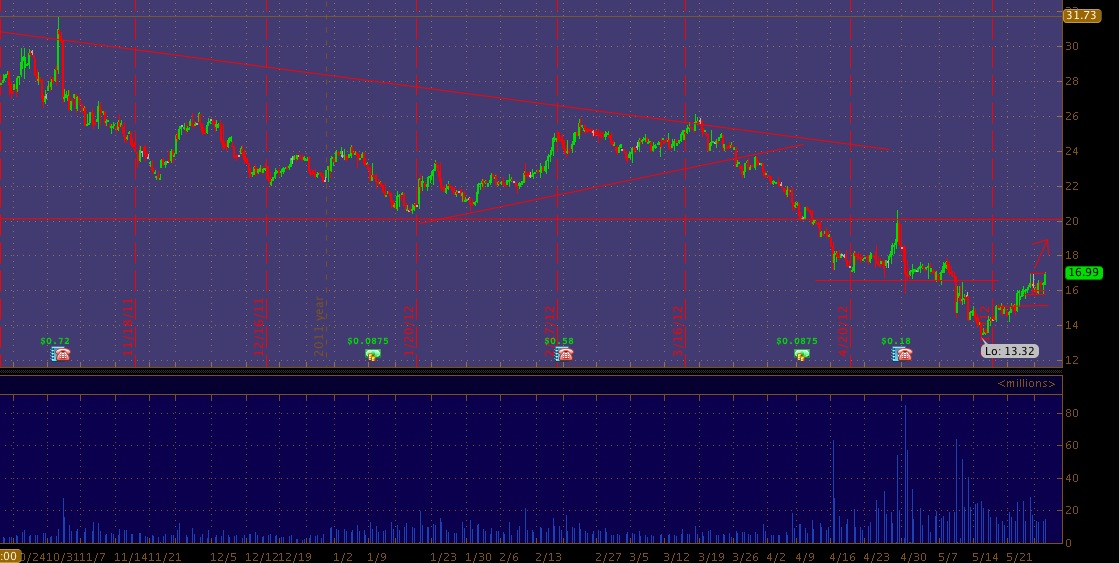
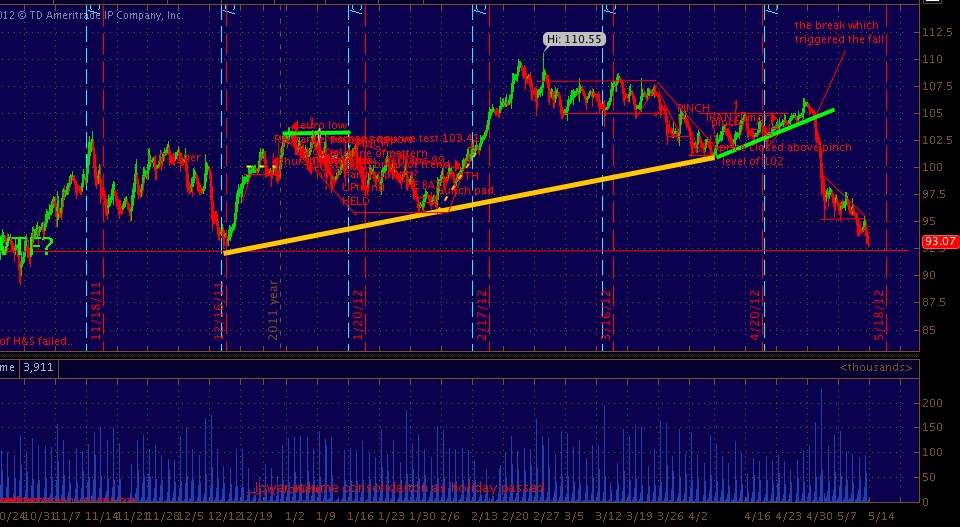
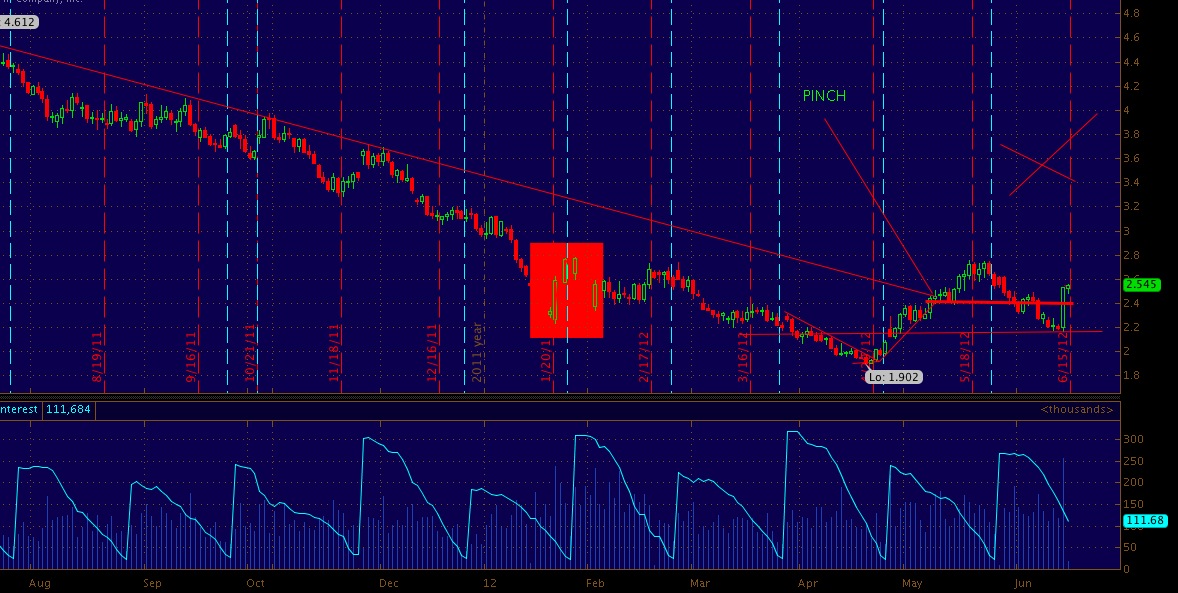
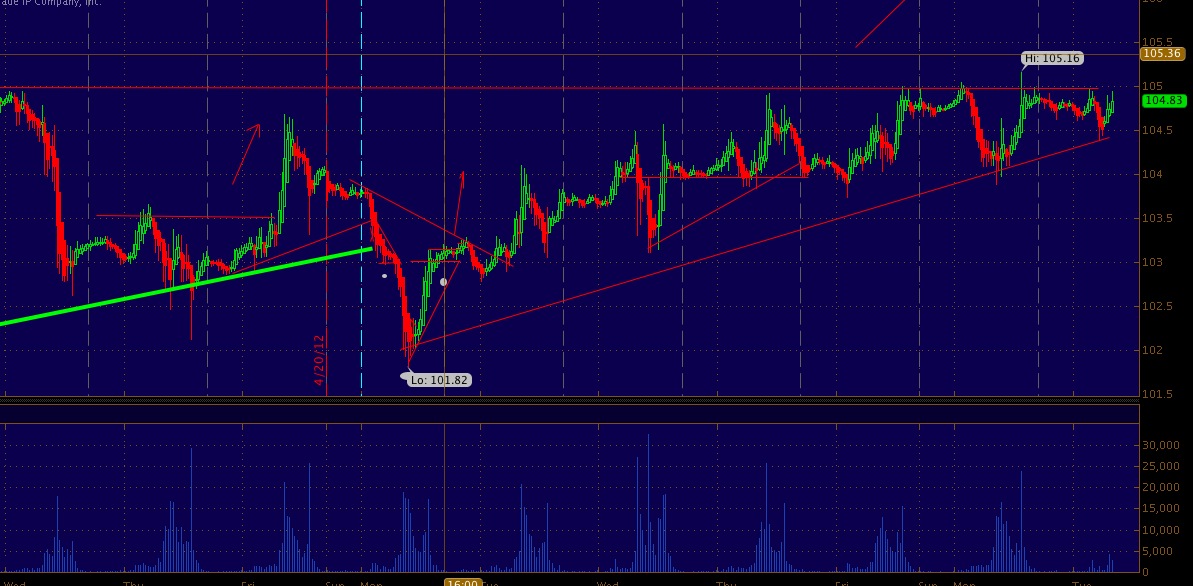
4 hour crude.. notice the 105 trend break of the green line
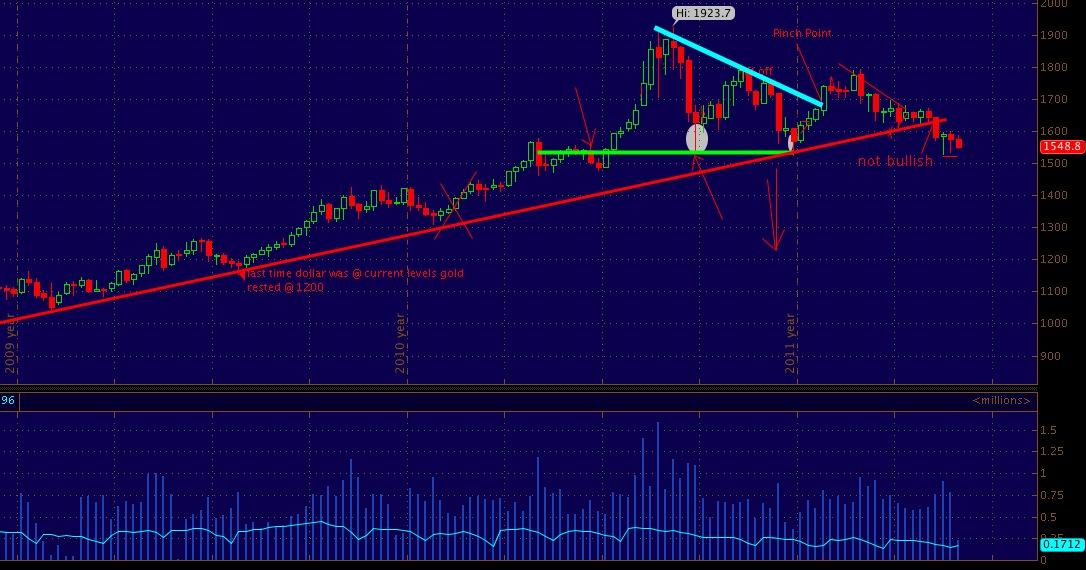
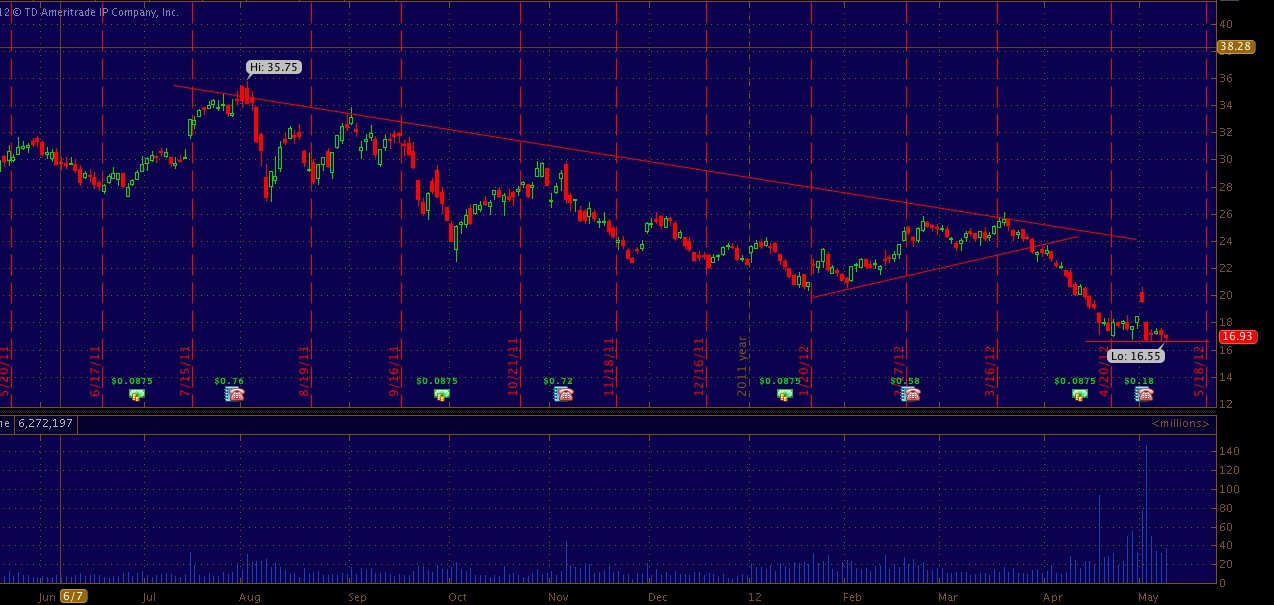
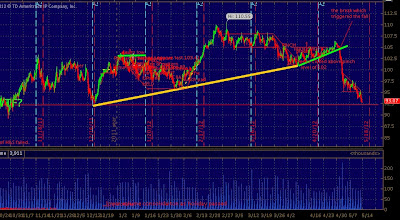
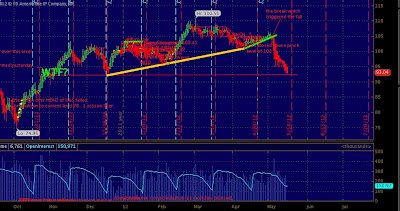
Daily crude (notice the 74.95 level) 
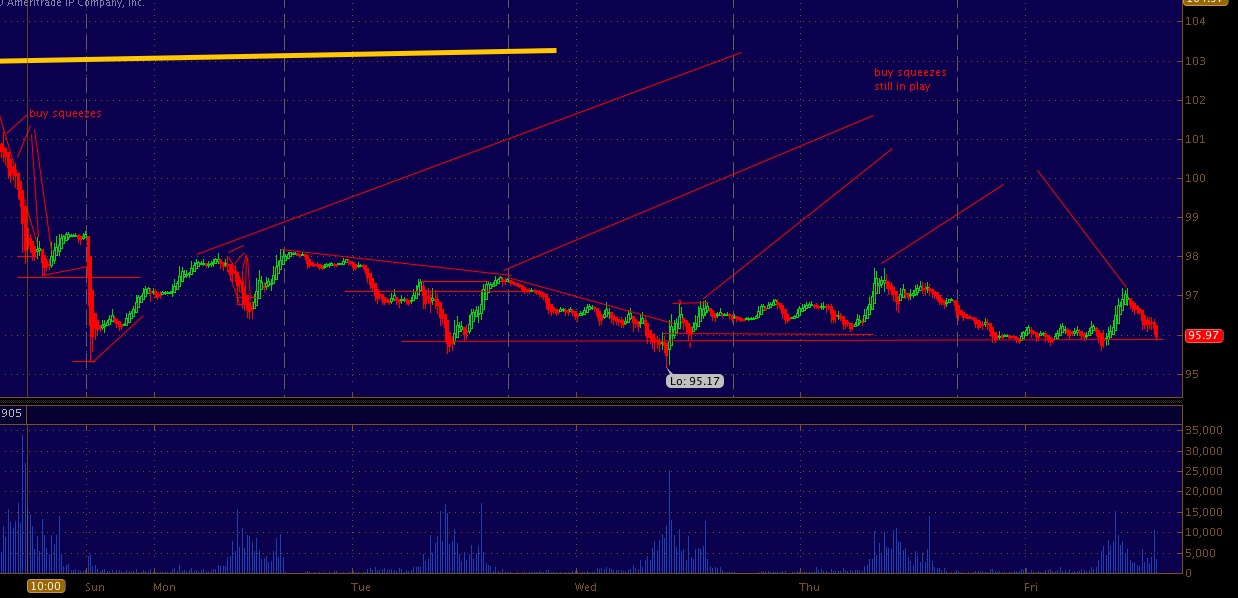
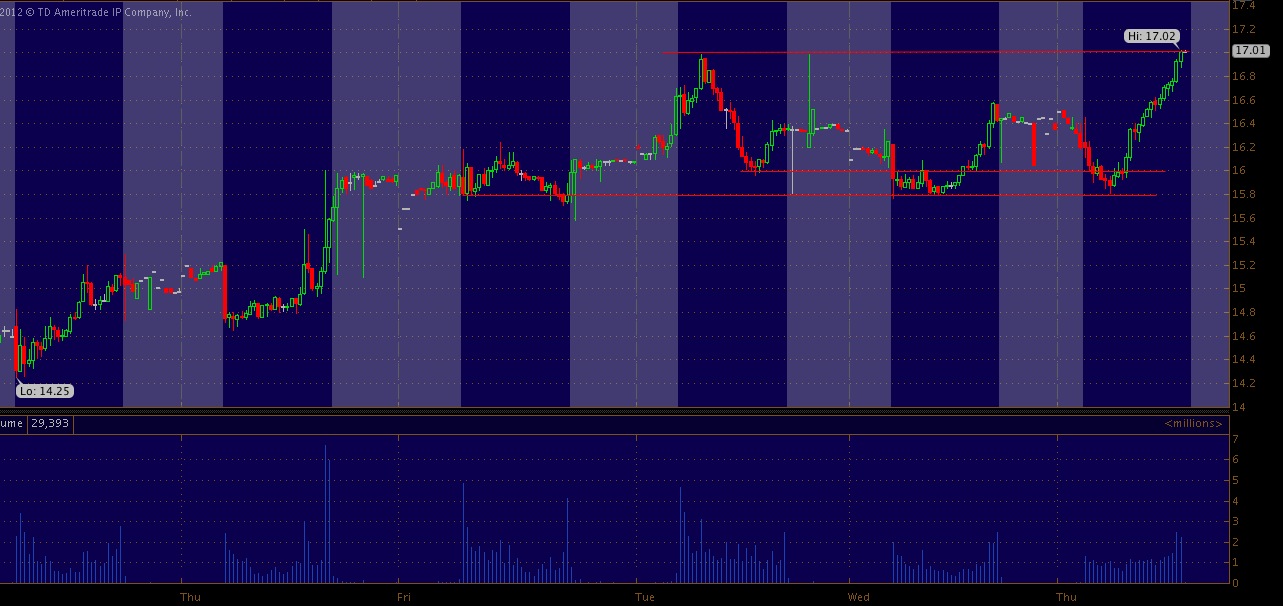
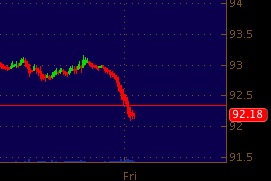
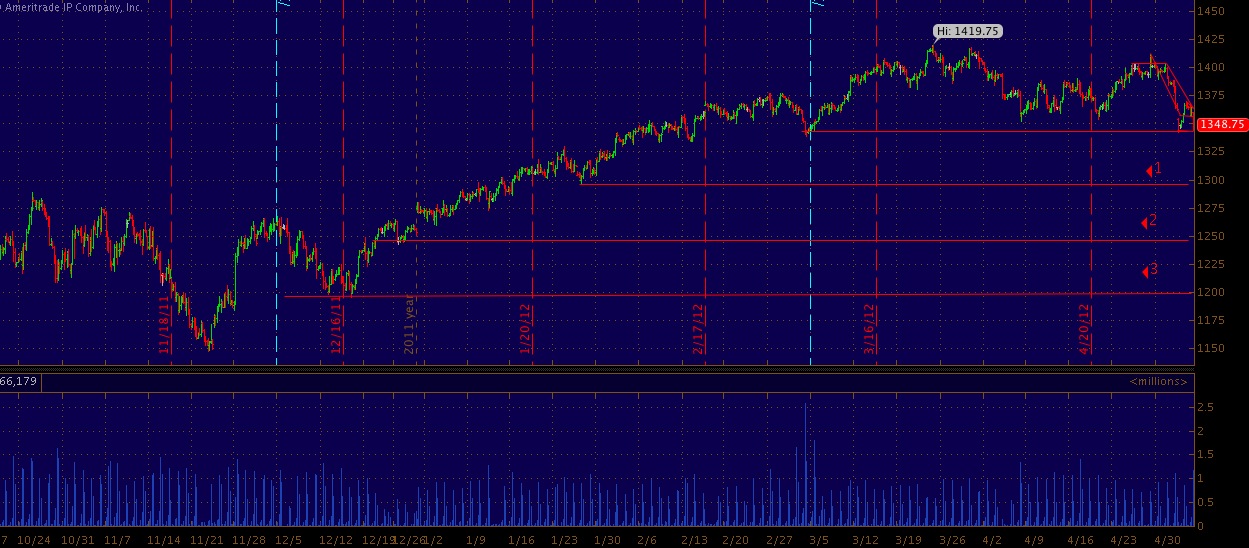
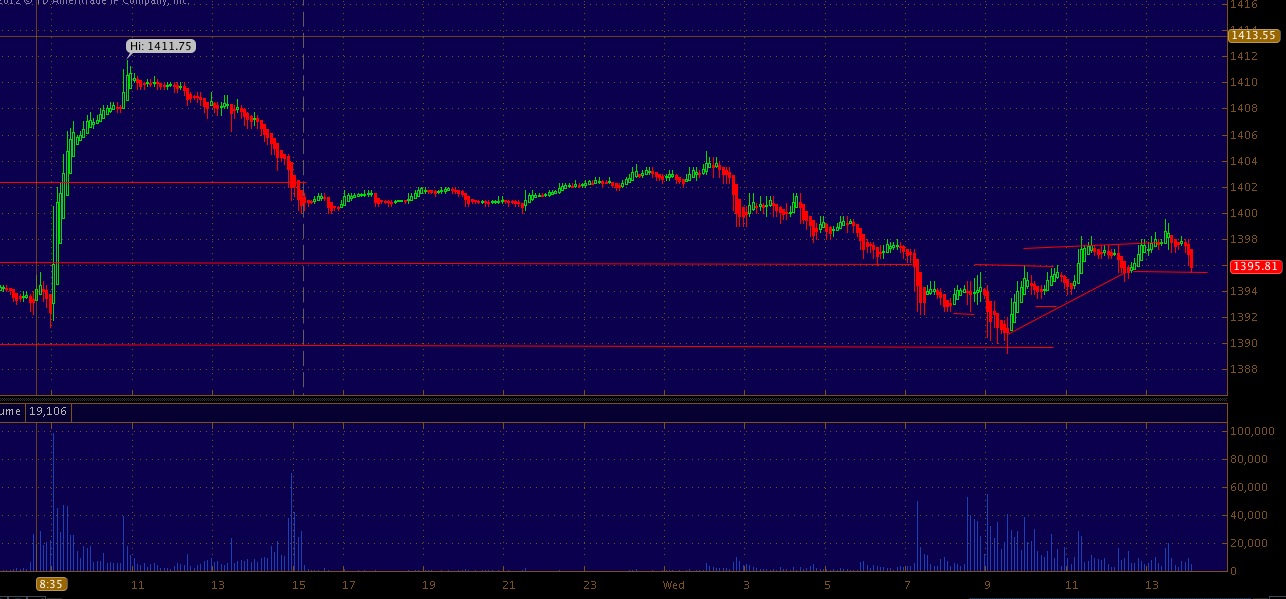
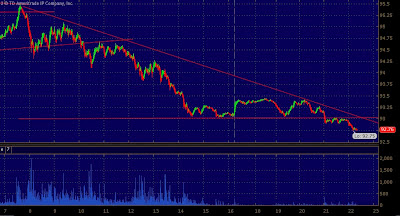
5 min crude 

Monday, May 14, 2012

Gold broke multi-month uptrend. looking for 1500

Daily GC - updated 5/23/2012
soon.. this chart is a continuation from late 2011 annotations which pointed towards lower prices, especially if the (red) uptrend line were to fai. it did.

Friday, May 11, 2012

Buy Squeezes still in play on Crude chart

as you can see below.. buy squeezes are followed by sustained selling.. as if whomever is selling still need a good deal of liquidity to keep the balance...

below 95.15 means 95.. below 95 means 90....          unless europe situation changes quickly.

1 hr zoom min CL
15 min CL 
4 hour CL.. notice the break of the yellow low (huge sell signal) then the air below 95 into 90... 

Wednesday, May 9, 2012

Amplifying NYSE TICK reading into jobless claims

might be nothing.. but is definitely something... markets moving in crescendo ...
5 min tick 

Natural Gas Daily, Hourly & Weekly charts

UPdated 7/24/2012 as the 3 level is now support... where is your head at? Pinch your way to profits
daily NG
*Updated chart below 6/16/2012
daily NG.. notice how the 'pinch' level has been regained 
If you have been actively following me you may or may not know i have been a strong believer in natural gas and a possible reversal in prices was not to be discounted given the current geopolitical energy landscape.

The time to dip your feelers into a long was when NG broke the $2 level; though now we may be seeing prices pinch up out of a yearly downtrend at the 2.45 level. IF this break out holds say from 2.35 to 2.40 the 3+ level could not be far away.
Daily
1 hour NG
Weekly NG

Tuesday, May 8, 2012

Healthy looking chart - Disney

the break out over the 44.6 level AH leaves us to question will this price action hold into the morning? if so the rising triangle actually defeated the reversionary tactics of HFT.

weekly Disney 

Daily Chesapeake Energy look

fwiw ..........CHK is not looking good after the 18 level gave way....... under 16.50 could mean 16...... notice the volume the second session of May.. over 140 million shares changed hands...long/short? who knows.. but whatever it is the position is big.
Daily CHK 

Hourly and 30 min S&P 500 charts

Are we near the abyss? yes.. below 1342.25 means 1340. below 1340 means (1) 1300 then if fails (2) 1250 if that fails (3) 1200... 

seems simple.. 

but that is the way we rose from 1068 into 1422... with commodity pressure still coming into the market and a VIX that still is showing calm it is anybody's guess what the market has up its sleeve. Greece really ruined any bit of confidence the eurozone had in the country, question is now will get get leaders elected before the country defaults in a month? 
1 hour
30 min 

Thursday, May 3, 2012

SPY Wicks? Just ignored? you tell me

blatant manipulation goes unnoticed and not investigated.. total bullshit.. clearly you can see the intentions of the long wicks.. designed to take out buy stops and or get traders to think the move is upside.. then shortly after the wick, the SPY price falls drastically.
1 min SPY 

Wednesday, May 2, 2012

The sideways market.. what is it waiting for?

Lack of conviction and conflicting world economic data has the S&P 500 in a wide slithering range which is chopping even the best.

best advice is to back away and only trade your best set-ups or remain hedged via a spread which captures declines in premium.

would like to see 1396 hold into the close to set the mood for this overnight session... the market behaves better when 80% of the bots are asleep.

If you have not yet... check out http://tradeforprof.it a twitter alternative.. as twitter has turned into a fairly useless medium for market related discussion.. Twitter is more a newsfeed and or bullhorn imo..

Tuesday, May 1, 2012

1 hour and 30 min chart look at Crude Oil

we got the break over 105.17 and the trade of 106+ exactly as highlighted below at 7:44 am CST.
1 hour CL
Above 105.17 could lift into 106+ below 104.50 to 104.20 could get dicey into 104 - 103.50 imo.
4 hour 
30 min

Newer Posts Older Posts Home