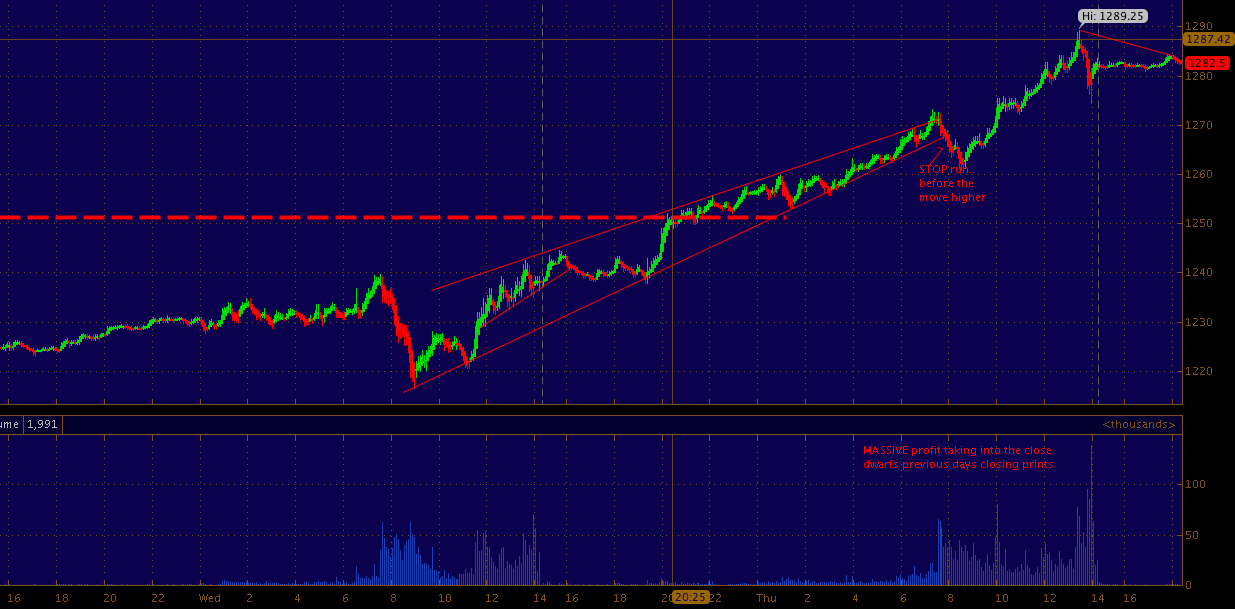
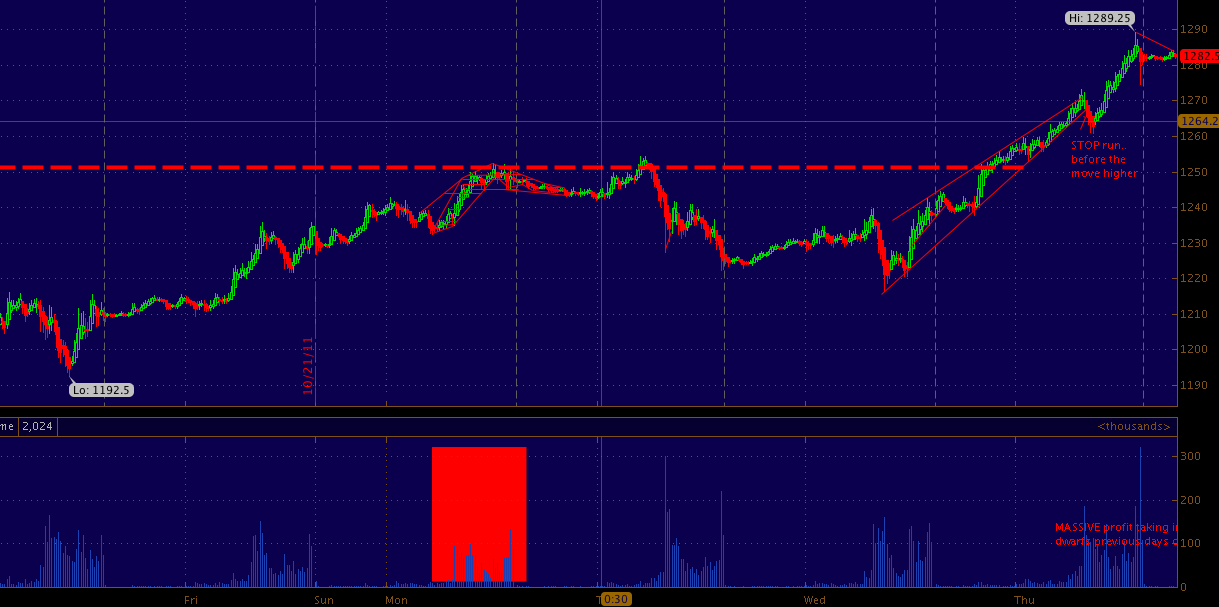
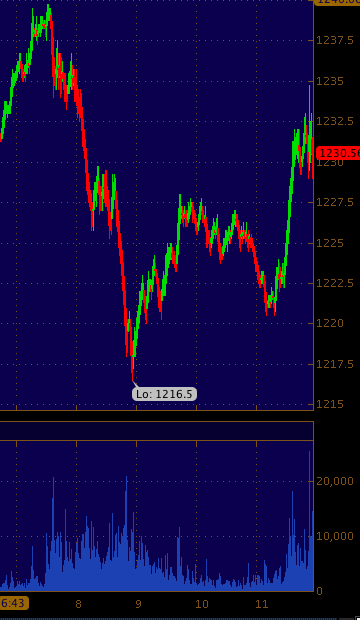
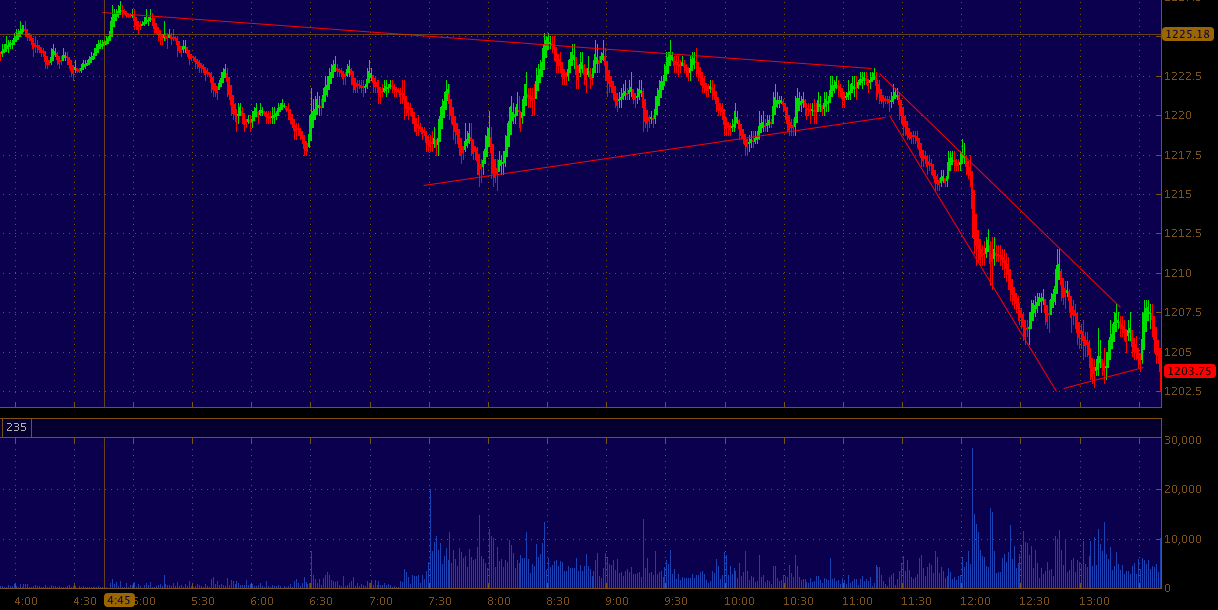
Monday, October 31, 2011

Post Close Charts & Musings (SPX)

15 MIN ES
Today turned out to be quite and eventful day, from the MF global blow out to the Bank of Japan intervention to devalue the JPY against the dollar.. because Japan is indeed and exporting nation.

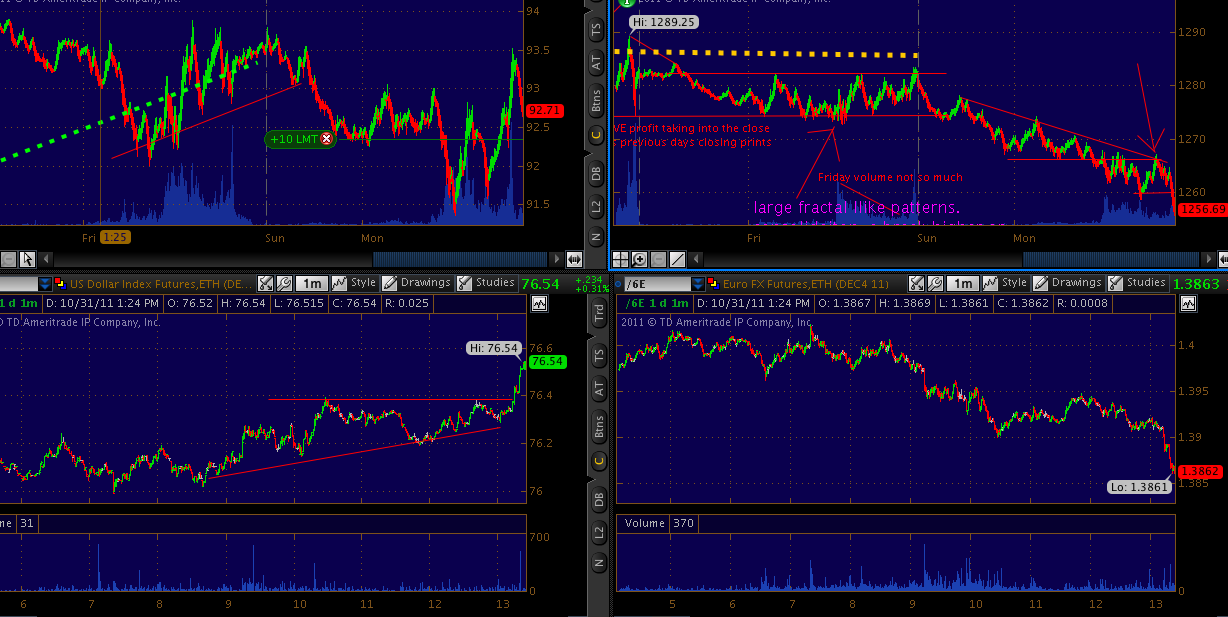
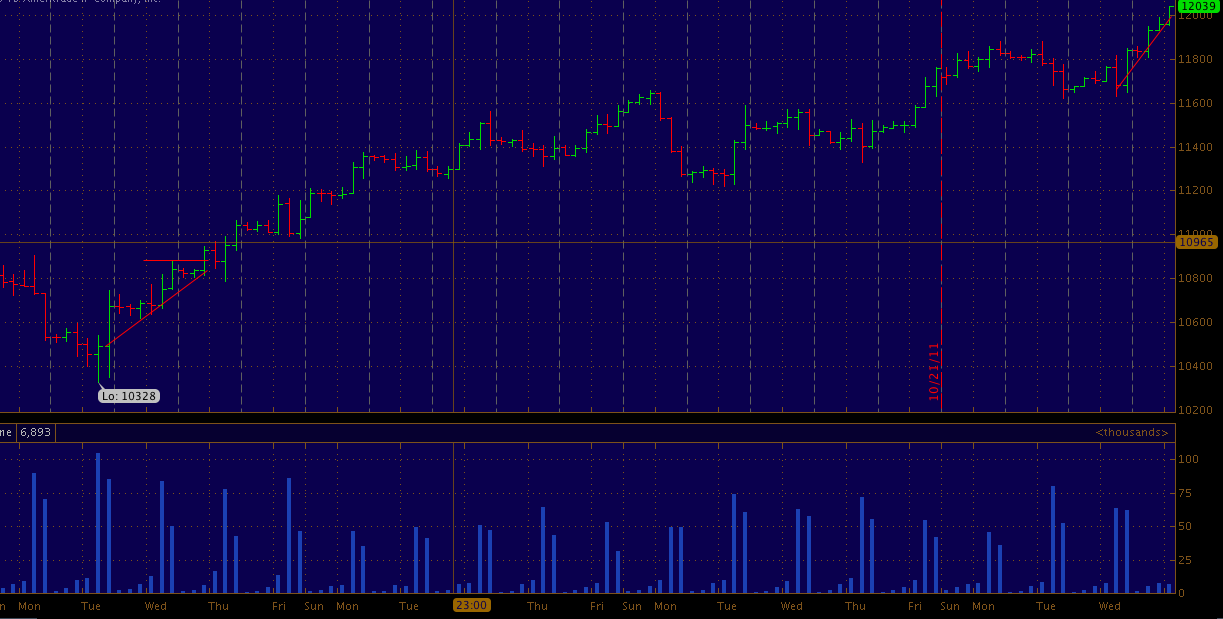
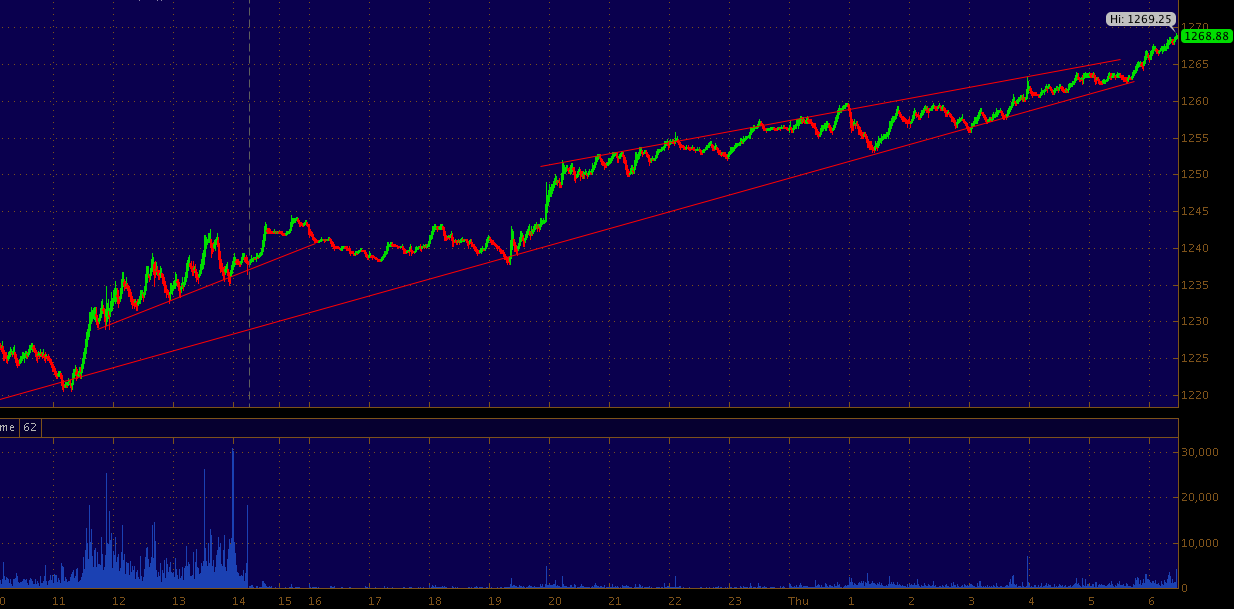
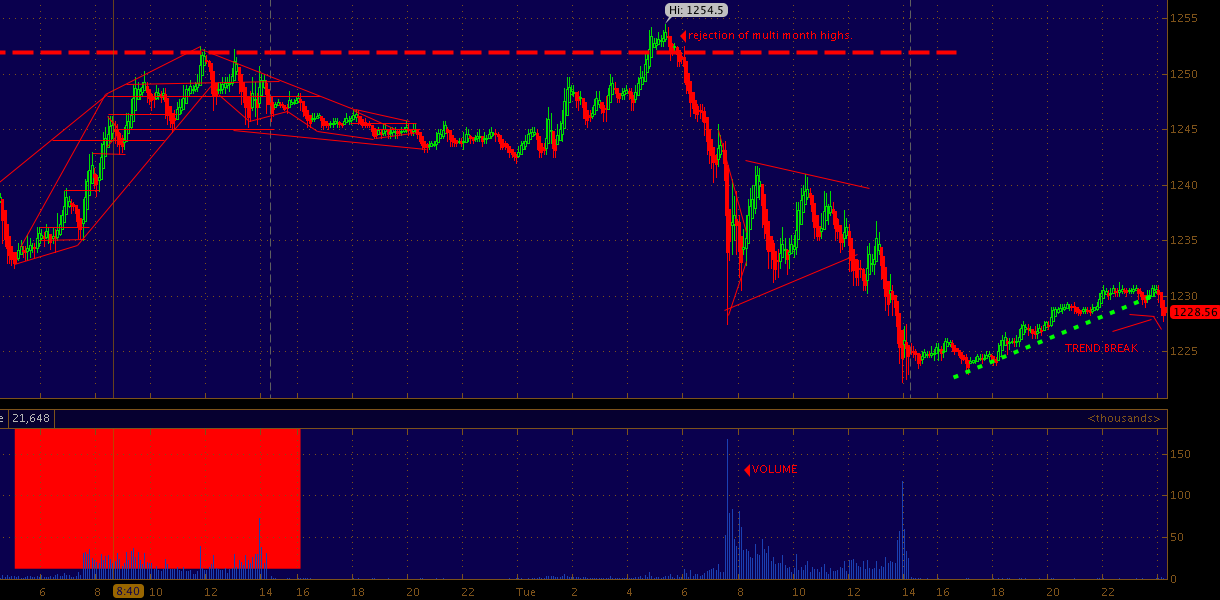
Beyond the news id like everyone to focus level at which the intervention took place in regards to the ES_F. All the powers to be understand the correlations of our markets and ill be damned if they did not pre meditate this "intervention".

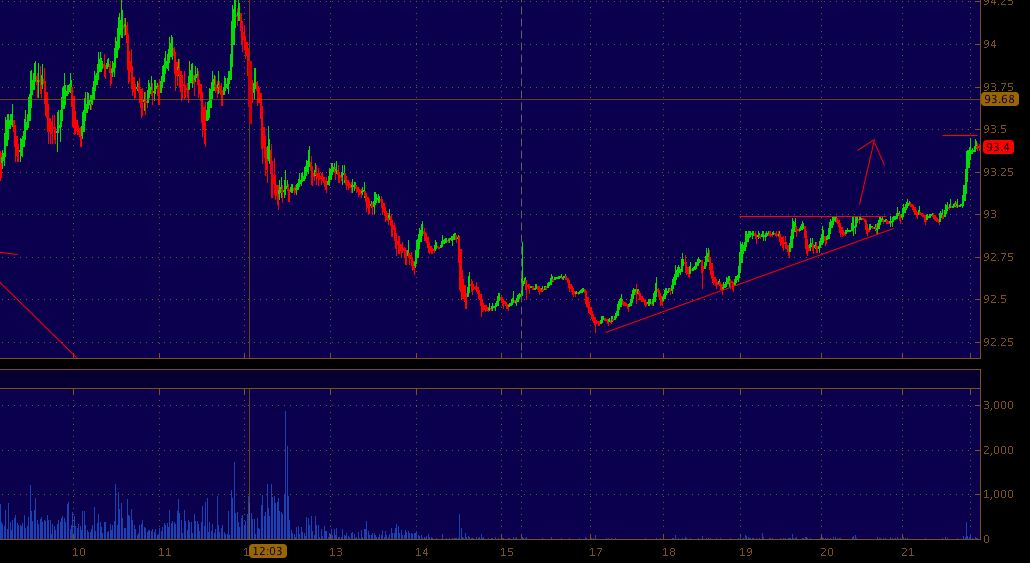
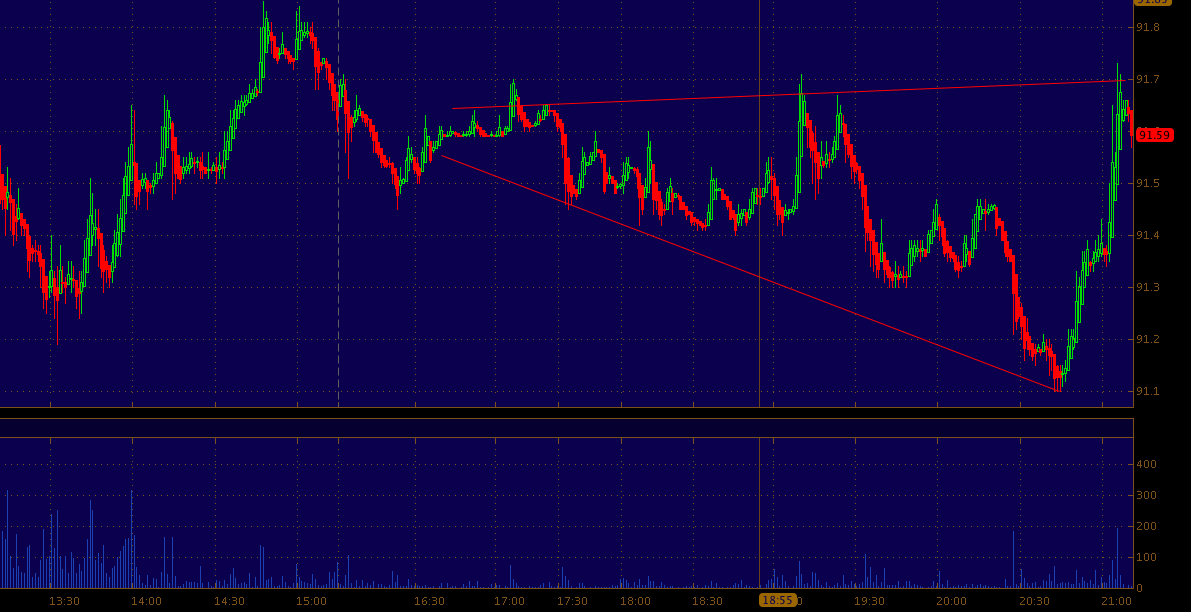
The meditation was hit his market where it will cause the most ruckus, that was via dollar. Arb desks blew their positions out and MF  global happened to go bankrupt. There are no coincidences. Just keep in mind technical levels in the marked do line up with unforeseen events. The market is seemingly random and indeed it is when the game is not

Late Session Correlation Update (SPY)

Dollar still hollaring.. top row is CL and ES 5 min's bottom DX and 6E 1 min.
Correlation's

DX coiled up for a possible late session run over highs (UUP)

Dollar break out -
5min DX
here she goes..

Monday Morning S&P500 Chart (SPX)

Funny how we pivoted @ 1386ish just as we were up against major resistance.. if we broke over the yellow dotted line we would go straight to 1350.... Loose .. the "perfectly timed" intervention...
Daily ES

USD/JPY Coiling up for move above or below 78.18 (UUP)

1 min 

Sunday, October 30, 2011

Tonight's Correlation Update DX, CL, ES, JPY (UUP)

clearly money never sleeps.
1 min CL & ES top row.. 5min DX & USD/JPY cross bottom row

ALL DX offers lifted to 75.80

Sunday Evening Look at Crude Oil (US0)

The blood of the world is sitting on a level i am watching closely 93.30 .. you can see in the chart below it will either hold and rise back to the 94 level or fall below the secondary uptrend...
30 min CL 

Post ES open Update - (SPY)

1274's defended as they were most of Friday....
5 min ES - 

Sunday Evening S&P500 Charts

5 min ES
1286 is the big upside resistance level.. over we could see 1350. Second scenario we could pivot back down to the 1200 level. 

The chart on the left is quiet interesting..... 
The chart below shows the channel the ES will surely break up or down out of (probably up if news flow is slow into monday) before the sun rises. 


5min ES

Friday, October 28, 2011

The 30min Crude Chart going into the Weekend (USO)

The range is 94.65 and 90... until we break either higher or lower you know the drill.. trade the bands.
30 min

Easy to Spot and Trade Pattern in Apple this Morning (AAPL)

Im sorry this is not "actionable" and no i did not see this pattern until i woke up from my nap because apple is not a pretty woman to me most days. She can look real hot some days and you take her to Mastro's and some days you dont even want to take her to 7 eleven.

Anyway notice the edge here... perfect formation, the prior trend was down in the pre market.. so clearly there was a seller before your algo's were switched on. they created this magnificant pattern.. putt it in your pattern bank and remember.... when the price nears the apex there usually will be movement opposite of the prior pattern, usually in the direction of the prior move before the price reached into the catheti of the triangle... 


now this can be actionable in the future. 

What only a 10 point S&P range today..? WHAT? (SPX)

heck i welcomed today price action.. i got some sleep and was able to take a step back and look and what we have done the past month without worrying about the ES moving 15 handles while i go grab K cup of poison coffee. anyway you can see for yourself, the range is about 10 handles. 1184-1172. If we break above of below we could see continuation in the break out direction if not. snoozer into close.
5 min ES

Thursday, October 27, 2011

Tonights S&P500 Chart. Post Insanity Rally (SPY)

5 min ES 
notice the CLOSING print volume of over 139,000 contracts. thats HUGE. i would expect to see some profit taking into asia open and into europe.. the dollar got rocked today, it usually has a reactionary move back up..

--That being said things have got a bit weird in the last week, lots of traders blown out. lots of traders are drunk on profits which in all honesty were derived from an offerless market.. all beta follows the wave... except NFLX.

last time we ripped up to these levels nearly non stop, we had a violent move down in a swath of profit taking.. expect this. keep your stops tight if you long and always protect profits like a boss.

15 min ES

Insanity chart S&P500 (SPX)

and no this is not regular session.. 34 handles higher tonight.
5 min ES

HURRAY DOW is back over 12,000

the dow is up 1,701 points in 16 days...
YM 4 hou

Australian Stock Exchange Closes Due To Glitch (ASX)

DOOH!!!!

(Bloomberg) Trading on Australia’s share market was halted for almost four hours by a technical glitch today, just days before ASX Ltd., operator of the bourse, faces competition from the opening of its first foreign-owned rival. 
The problem happened just minutes after the start of trading, depriving local investors of the opportunity to react immediately to a breakthrough in Europe’s debt talks, which sent the benchmark MSCI Asia Pacific Index up 2.5 percent. Australia’s S&P/ASX 200 Index jumped 2.5 percent after it reopened at 2 p.m. in Sydney.
 yeah glitch my ass.

This morning's S&P500 Chart (SPX)

UPDATE showing break over 1265 .. looks like 1270 is next... notice how the apex of the wedge reached a fairly tight point and the price broke out of the condensing channel..

1263.25 is the high so far.. 1260 now support.. 1255 is the lower line in the sand IMO. if this level breaks we could see some profit taking down to the 1245 level as we are up 1.88% on some bandaid of a 50% bullshit greek debt write down. More stupid bastards getting rewarded for crashing their Ferraris into wall.
1 min ES

Buy stops triggered over 1260 .. (SPY)

GOOD morning.. 

Wednesday, October 26, 2011

5 min look at crude over the last 3 Days (USO)

Chart update for CL. notice the yellow dotted line i mentioned as support.. it held solid.. and rose over 1.2 points above.

large moves from the mid 80's up to the mid 90's and back to 90. notice the yellow dotted line as support. OIL is still leading equities. though correlation break down could be coming soon.
5 min CL

How many Squeezes can fit into 11 days? (SPY)

about 6.. look at these ranges. violent as all hell.. circling around the same prices over and over again.
30 min ES

Heck of a Range Today in the S&P's (SPY)

from 1240 down to 1216 back to 1232... whip saw.. we just saw the days largest print up over 1233.

S&%500 5 min chart for tonight (SPX)

1230 trend break was detrimental to upside volume.  will buyer step back in.. or will CL lead us bak into the red?
CL 5 min

Silve Chart For Tonight/Morning Showing Break higher (SLV)

Tomorrow will be interesting for SI as this is the second day we have seen large spurts of buying/covering.
5 min SI

Tuesday, October 25, 2011

Tonights Crude Oil WTI Chart (USO)

CL update 93.50 target met. after the break out of the ascending triangle.
1 min CL

stockMONSTER live From the Nasdaq (QQQ)

Great video from my partner Wesley Harr. Look for me in Time Square in the next week or so.
We invite you to come trade with Weslely & myself.  in our stockMONSTER environment.


stockMONSTER saved me $105,350 in one session by coaching me through a 49k share trade. The cool heads of the moderators and the support of a great group of smart traders makes all the difference in the world.
- Bob W.

20 Year Look at The NDX (QQQ)

Notice this channel we are in.. a 15 year channel..The price keeps pushing up into the 1365 level.. but cannot break out.. will it break out? and send us back to NDX 4816.35. another bubble? or do we trade back into the channel.
NDX 20 year 

Crude 10 bucks in 2.5 days (USO)

Proof is in the pudding. hope all the genius algo's out there caught the signal. should make you all rich beyond your wildest dreams.
5 min CL 

Tonight's 4 hour S&P500 Chart (SPY)

4 hour ES
Over 1250 we go to 1300.. if we fail, we could see a test of 1300, followed by 1190.. Granted a new channel of 1300/1200 will be formed if 1300 is met. What is moving us higher is still short covering and buy programs pushing index markets up into buy stop areas. there is still not much average retail interest as you can see by the volume histogram at the bottom of the page. Todays volume was very low.

Are we reaching a point of exhaustion, or will a new group of shorts get run over into the the 1300 level? either case could play out. be prepared for either scenario. it is obviously the 1100 level is a level which see's huge volume when it is toyed with which makes this rally somewhat believable because of the amount of volume which was triggered at this level. Will there be enough good news to keep the ES over the 1300/1400 level ? will the next phase of QE take us into record high territory as inflation really takes hold? this could be the case if the fed gets their way and europe sweeps itself into 60's levels of economic growth. All bets are off.
ES 5 min.. Lowest volume in WEEKS.

If you think i am shorting this market every day all day you are wrong. all sell signals have been false thus far. There is a form of QE going on behind the curtain beyond operation twist, though we as a group of market participants have not yet been informed.

Think stabilizing bids and increased overnight volatility with regular session prices usually only circling around the overnight prices.

Monday, October 24, 2011

Crude Oil Magnifying Pattern Tonight (USO)

Crude updated ... it traded over 91.80 and ran to over 94. simple set up.

over 91.8 . we will rip higher perhaps to 92. .. fail we could move down to 91.10... perhaps

1 min CL 

Wednesday, October 19, 2011

Steve Wynn Rant from Q2 Conference call (WYNN)

Originally from Zerohedge,  thought i would pass this on to my readers. As i am agreeance with Mr. Wynn.

highlight below...

Mr. Wynn - " I am watching my employees standard of living drop off because of deficits. I think that the American public is beginning to make the connection between deficits and their own loss of the standard of living....


"Rich people are now being defined by the administration as people who make a million dollars. Well, most of the businesses in America, other than giant corporations, are paying taxes under chapter S, partnerships or individual proprietorships. So somebody shows that they make $3 million or $2 million this year and they pay personal taxes on that money. They subtract their cost of living and then what's left, and that does not show that probably 25 or 30% of their profits are tied up in accounts receivable or inventory, stuff that they can't spend or get their hands on, but to support their business and their employment, and then they take whatever is left, these so-called millionaires, and they open up another shop or another office and that, that is the only known engine of growth of the United States of America, and we have an administration that is fanning the fires that this is somehow undeserved, profligate millionaires, and it is worse than hypocrisy. It is totally dishonest."


"But I say right now that the Democratic agenda of spend and bribe the public has bankrupt this country, and until it stops, the citizens of this country are in for more hard times.
And fancy speeches aren't going to change that.
Only a fundamental realization that citizens are going to have to take real, sophisticated responsibility for how we allocate the resources of this country"


A Picture Is Worth 1000 Words - run aground tanker? (USO)

i spoke to the harbor master.. "bow thruster repairs" .. hmm

ES Chart pattern of the day - 'The Forklift'

yes.. looks like 1210 is in the cards if they raise the front of the lift...
1 min ES

Buzzkilling by

ES Break Down Through 1205. Only to be Saved with . (SPY)

a 350 million dollar buy imbalance.. like they even matter.
1 min 

The Stock Market 'levitation' Phenomenon Explained (SPY)

Quantum Levitation......

Tuesday, October 18, 2011

Tuesday Evening Charts (AAPL)

Wild day once again eh? bullshit news, front ran by bullshit tickets. Rinse, repeat.
From 1230.75 sunday night down to about 1188 back to 1230 this afternoon i'd say is one hell of a move. and def not healthy, but hell it is presenting buying trading opps if your fast as hell and or lucky as heck.. maybe both.


since really most of you only care about charts (i would think) here are today's 5 min and 15 min's.
15 min ES

Apple Missed Q4 Earnings (AAPL)

Yep  .. i bet it bounces around like a pogo until the fan boys realize this party cant go on forever...

Apple reports Q4 EPS $7.05 vs. $7.28

Reports Q4 revenue $28.27B vs. $29.45B. :theflyonthewall.com
Apple sees Q1 EPS about $9.30 vs. $8.98
Sees Q1 revenue about $37B vs. $36.63B. :theflyonthewall.com


Yesterday Losses Erased in the S&P500 in one Swath (SPY)

19 hours of selling from 1230.75 down to 1188 retraced in about 6 hours... back to 1230...
ES 5 min .

1230? yep More Bailouts for Europe (SPY)

yeah .. normal. traders stopped everyone who was long under the daily trend @ 1209.. then 1230..
ES 1 min

S&P's are about to make a move

hmmm break down?
1 min 

The Alligator Pattern (SPX)

This pattern is only possible when the index moves straight up with volume moving straight down.
the 5 min alligator mouth

Four Red Boxes Sum Up Today's Trend (SPY)

Buy program, idle. Buy program, idle. Buy program, idle. Buy program, idle. .. repeat until the machines decide they are done. this has nothing to do with individual traders or speculators.
1 min ES

Tonight's 5min WTI Futures Chart (USO)

quick update as 86 failed.. retest perhaps coming.. though the ES did see volume pick up as the overnight uptrend was deviated to the downside @ 1192. traded down to 1188
CL 5 min
The 86 level is back in play as a seller is slow and steady... If 86 is broke to the downside a 50c drop could ensue. If 86 holds there could be a quick bounce back up to 86.20

Monday, October 17, 2011

Tight Like A Tiger - ES chart

quite the reversal.. all the fun and games happen when you are asleep.
1 min ES

Sunday, October 16, 2011

This is the Deep end of the pool (SPY)

did the trend just break.. or is this just a patience testing? tom tomming? a push below support to take out tight stops before new highs are made?
ES_F 1 min 

1, 5min & 1 hour S&P500 Charts ...

1 min ES
Another Sunday another up day. Remember the machines/stabilizing bid* buy when you sleep and when  you animate.

The ES is approaching a break out here, up or down.. over 1230 we could go to 1260, below 1215 we will have a break down.. As i type this the ES just poked 1227. Here we go..
1 hour


5 min

Newer Posts Older Posts Home