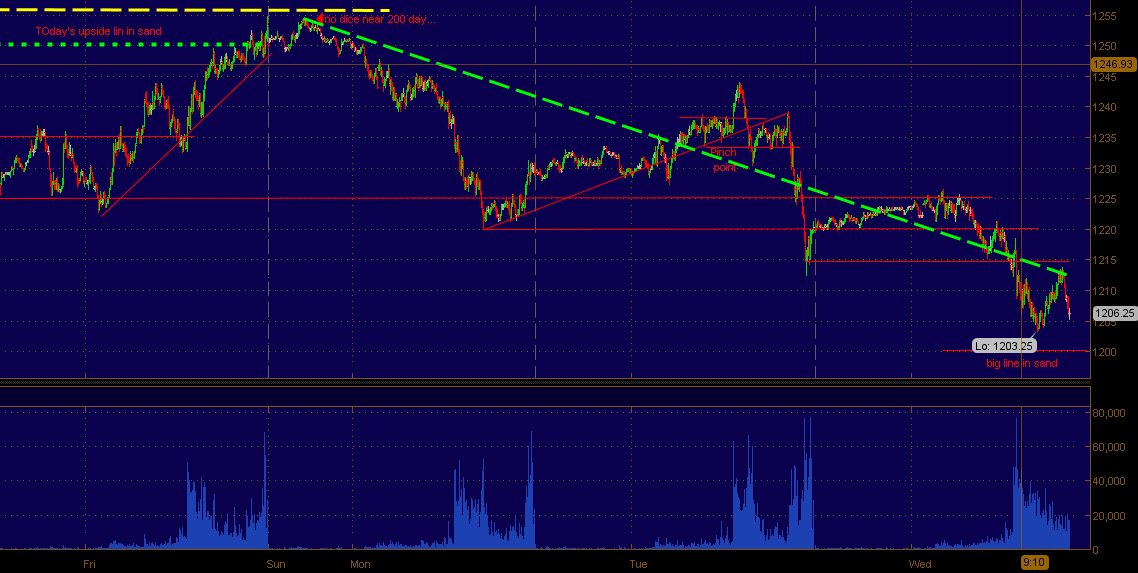
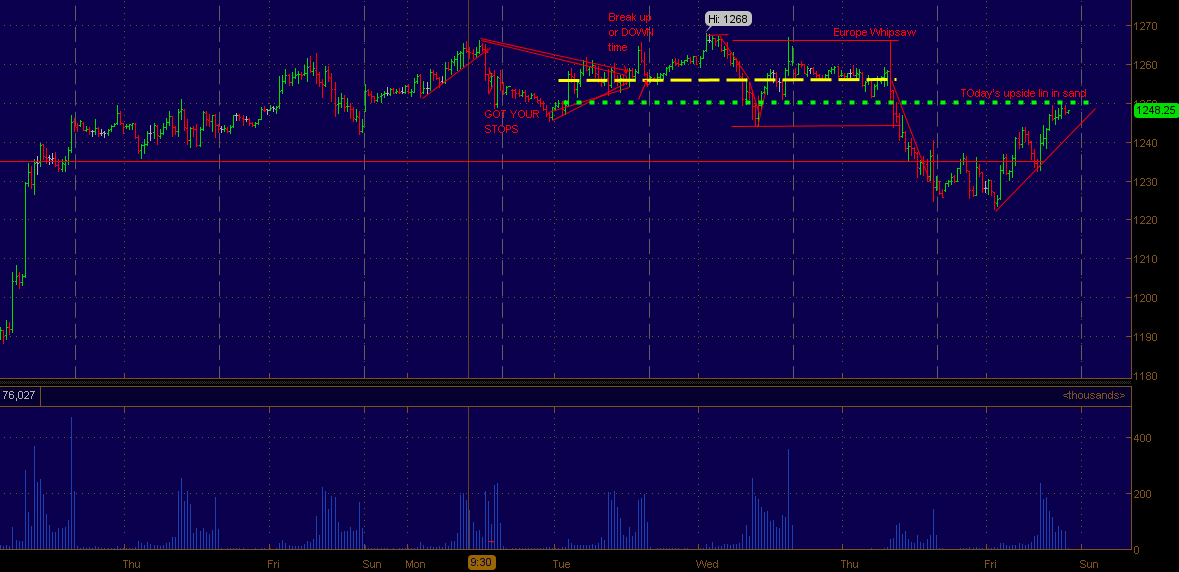
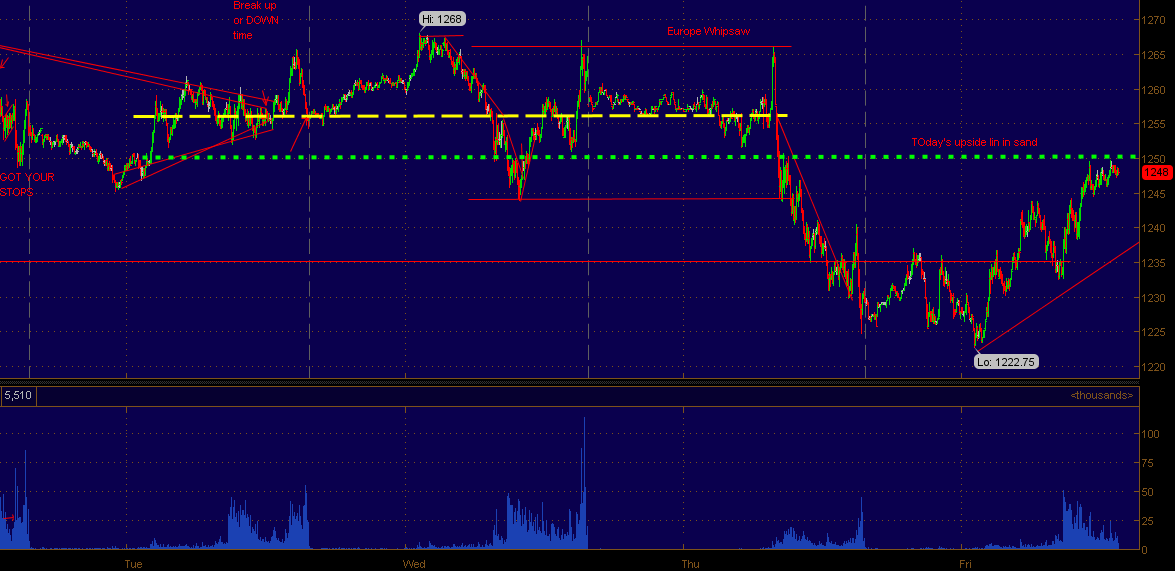
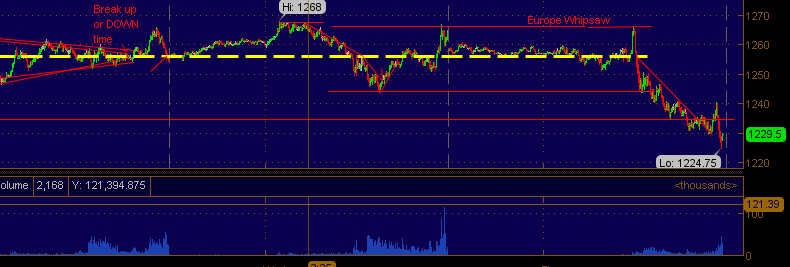
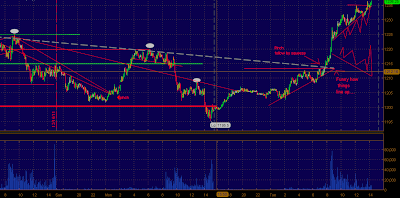
Thursday, December 29, 2011

Late Day S&P500 Futures Chart (SPY)

As the dollar fell off of highs of 80.31 this morning and the rest is history............Same prices .. different day. Yesterday's selling from cash open on has been retraced today on half the volume. Strong market? eh Or just a market which gets ramped at any opportunity of a thin market?

From a low 1244.25 at 3 am in the morning to the high of 1258.50 this afternoon...


Dollar fell off of highs of 80.31 this morning around 6 am as the ES sat on 1246.. from that point on the DX slid and the ES rose as well as Gold... at one point gold was down 32 points only to retrace 50% of it's losses as the euro crawled back into bed after fallout clear under 1.30 mid day yesterday.

Crude.. mean reversion.. opened around 99.70 traded down below 98.50 only to close back at 99.70 .  It sure looks like it wants to move higher after it took hours for 99.26 to break.. when it did it only lasted a few hours.

5 min CL 

Wednesday, December 28, 2011

A Daily Look at Gold Futures Going into 2012 (GLD)

updated 3/21/12 - Still sticking to original thesis. Only portion of thesis omitted... the dollar has already popped into 82 and relented. dollar out of equation as trust comes back.
GC weekly
GC Daily
Dollar running the show from the looks of the lower plot (DX) .. notice the X's .. last time dollar was at these levels over 80.... GC was sitting on 1400... If the descending triangle highlighted above breaks down through Oct 3 support around 1535 we could see a quick 70 point drop into 1400, this scenario can be amplified if the dollar breaks up over 82.

Late Day S&P500 Futures Chart

5 min ES
The channel was broken to the downside @ 1257.75 which lead to a trade down to 1245. Not a huge move but the market has been up 5 sessions in a row basically for no reason but the opposite of down.

below 1244 sell stop surely lurk. DX is keeping the lid on things commodity speaking. Oil again failed over 101 and now is back under 100. Gold is not liking dollar strength. This information tells me the dollar long and squeeze is still in play. Trade what you see and be patient. Those who predict never really know.. unless your a weatherman. but they suck anyway.

Im just a poser though, i know nothing.

Tuesday, December 27, 2011

S&P500 Future 5 min chart for tonight

5 min ES
not much to talk about.. trade it within this channel.. or wait for confirmation of a break down or break up.. 1260 is sticky....

Very sophomoric analysis i know.

Post 100+ Close Crude Chart (USO)

5 min CL
A close over 100 is something that has eluded the crude market the past month and half or so.. but we got it today. The 101.77 high was achieved after nearly 3 sessions of sideways action. 100.15 was the upside resistance which had been tested last thursday and friday numerous times only to find sellers above

the 103.50 level is a level i am watching to be taking out for this 'rally' to continue. if not we could fall back to the 95 level in quick time.

Crude is very much disconnected from its past 3 year positive correlations to equities, but it is a light week of trading and volume will come back mid next week.

Financials are fairly weak today...

Friday, December 23, 2011

Closing Print Rammed Right up the Chimney

5 in ES
1260 met... like a magnet.. close 1259.50

Crude hanging out @ 99.80

Dollar 80.30

6E 1.3062


5 min zoom

A Shortened Day Calls for a Quick S&P500 Chart & Thought

1 hour ES ..
So far we are following a down trend from highs of 1268 from two weeks ago.. pressure is on the 1260's for sure.. if they trade and are firm this could be the 'pinch' the index needs to jump into the new year.. THOUGH this santa rally as you can see by the red line on the volume plot has been declining.. even on red days declining but more pronounced on from 1200 to 1260 in 4 days with zero concrete news... unless this tax issue washington resolved for two months is good news in your opinion.


Crude.. you know.. ran to 100.20 then failed miserably.. now back to 99.80... 


Currency's quiet.. DIVERGENCE 


if 1260 again fails.. i am looking for 1240 sometime next week.. if the bots push us over.. even on low volume... it will trigger all kinds of alerts and force shorts out.. has happend to me.. price is still price.

cheers. be safe.

Thursday, December 22, 2011

SIde By Side Look at Crude & S&P Futures

5 min each.. original chart below from last night.. correlation still quite strong
5 min each.. CL left ES on right....
1260 before Friday? ---- 1258.5 traded
100.20 by Friday as well?   ---- 100.23 traded on the DOT ...

Merry Xmas

Mid Morning S&P500 Futures Chart

5 min ES
Over 1245 means we test 1249.. over 1249 we could go anywhere on this very light volume..
Crude running continually higher as the Santa man approaches. Currency's saw some movement overnight with the euro bidding for a bit over 1.3 and dollar falling under 80.. though once again they are back in their channels and equities are surging forward despite their historical correlations.

on the downside if 1230 fails we could see 1220 quickly.

Overnight look oil futures

1 hour crude 
IF 99 can hold with a trade over 99.20 we could see 100 quite soon.. if this trend does not continue .. we could see a quick drop back into the 95 area . perhaps. Been an odd week.

Wednesday, December 21, 2011

Wednesday Evening S&P500 Futures Charts & Musings

5 min ES
Pretty tame session today volume wise, though the index saw large price swings from 1249 down to 1233. Pretty much no real concrete news or anything knew to speak of to cause the large swings besides a crude inventory draw and some tepid home sales..

The downside pivot today coincided with this past Friday's high as well as yesterday's mid morning ramp initial resistance point. I expect some of the same action going into tomorrow and into friday... Friday half day remember.... Crude oil has disconnected from the rest of the train trading over 99 this morning and evening. Just in time for Christmas 100+ potential oil. USD and EUR quiet & locked in a range.
30 min CL 

Tuesday, December 20, 2011

Santa Clause Rally In Chicago With (HOV)

Turn Around Tuesday - S&P500 Futures Chart (SPY)

5 min ES
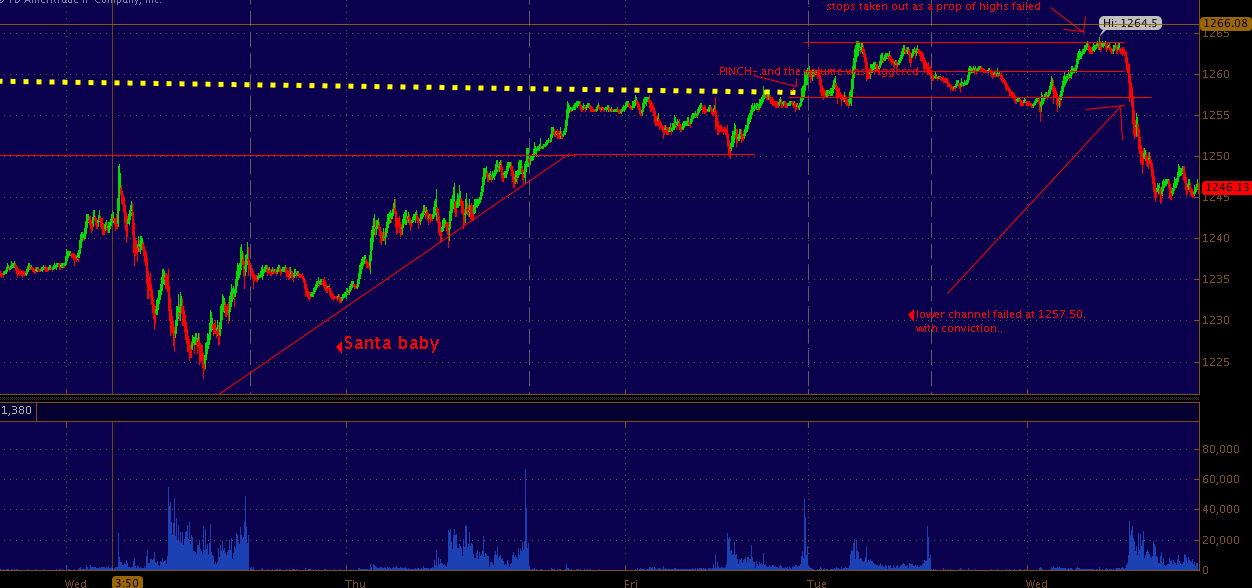
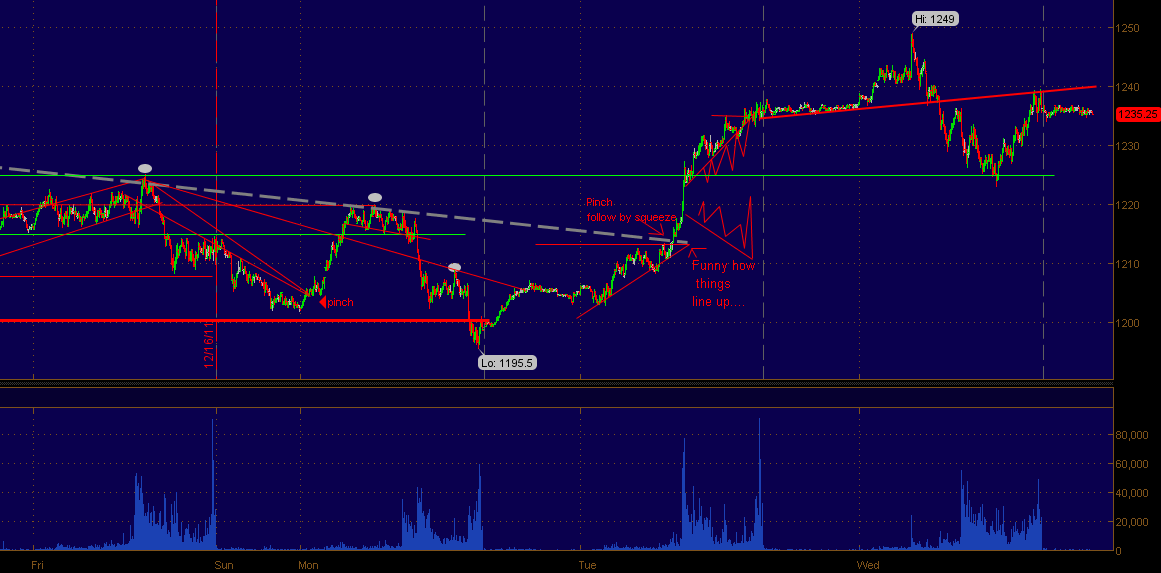
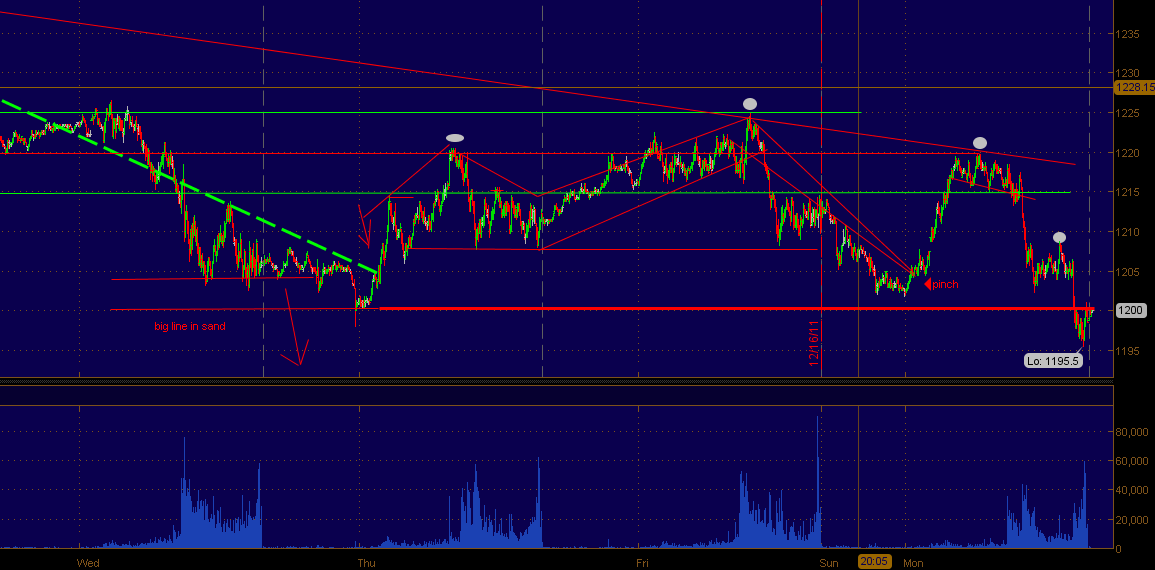
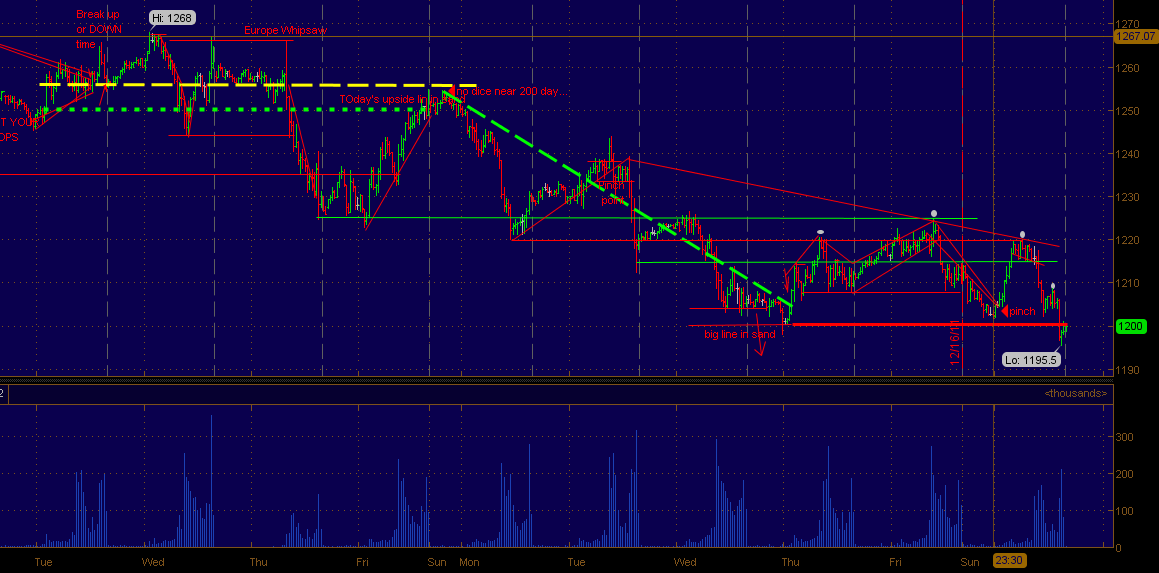
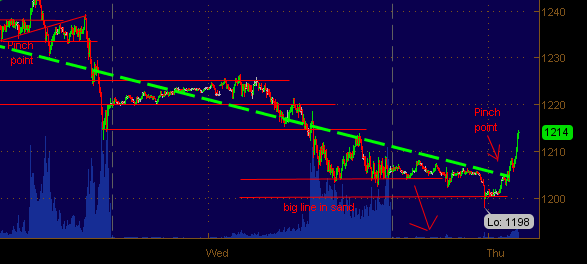
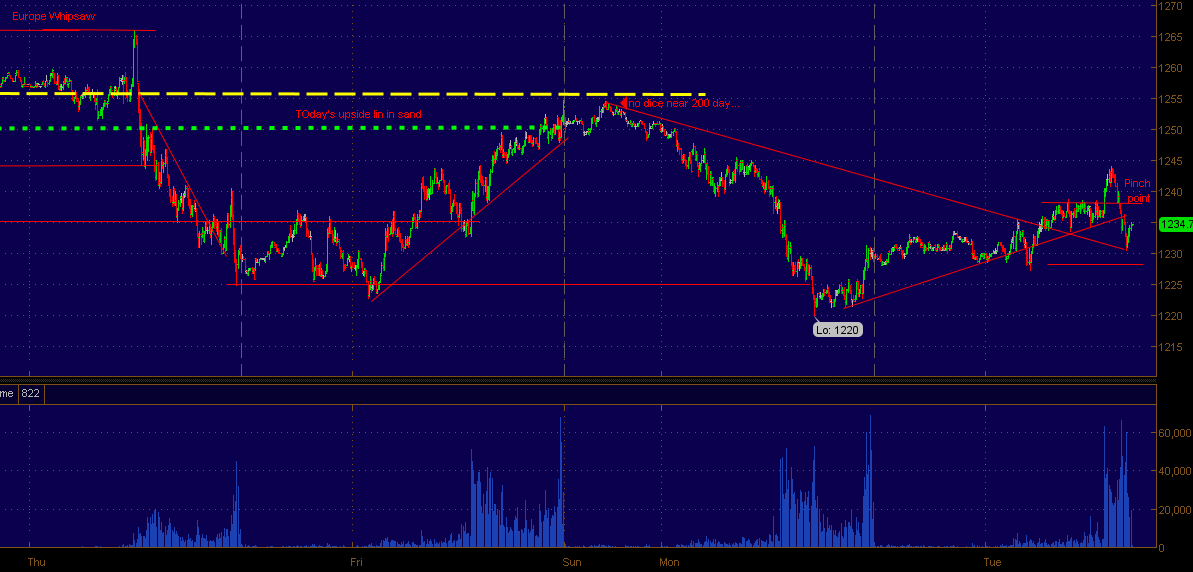
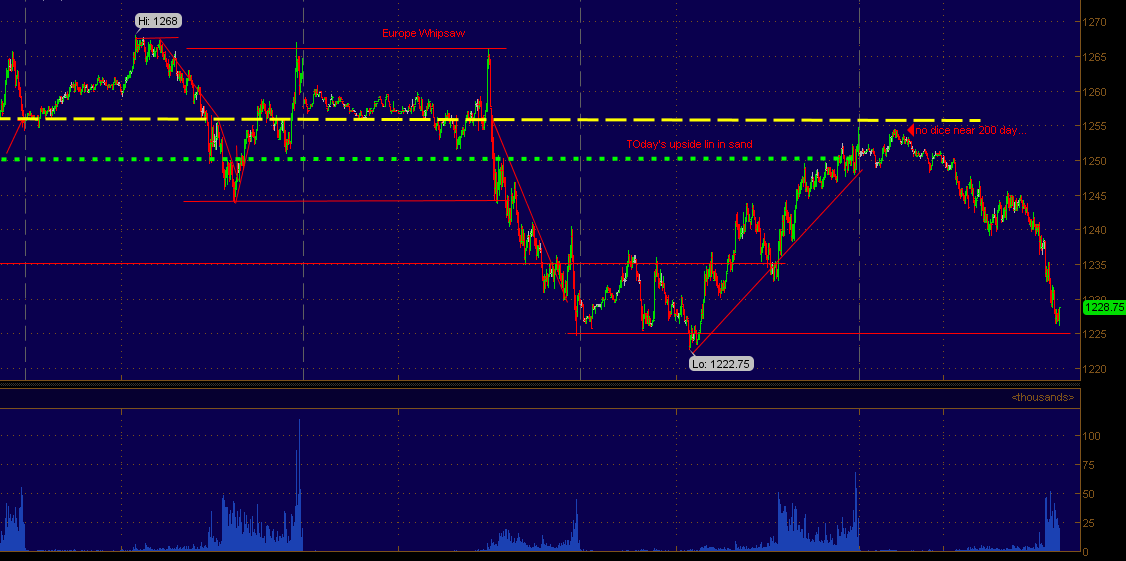
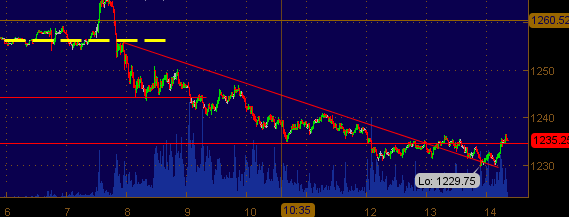
Again the day after after we make a new multi-month lows below 1200 we have one hell of a squeeze. 1200 being the line @ which the price must not close below, or we are being led to believe by Santa.

We all know the real story behind Santa and we all wish he were real.. but indeed he is a farce.

Does this mean this rally is a farce? no price still pays but you have to factor into your jubilant trigger finger.....when less participants are in the market prices become more volatile because there is less size on either side of the market. that is the the nut shell version why? because the media gives us everything in a nut shell anyway...

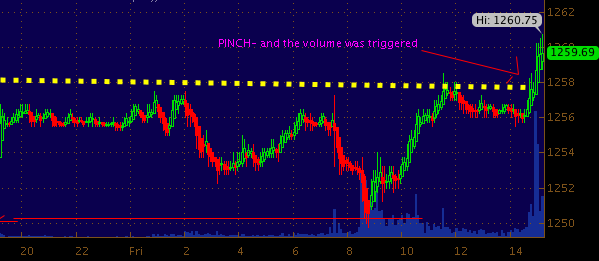
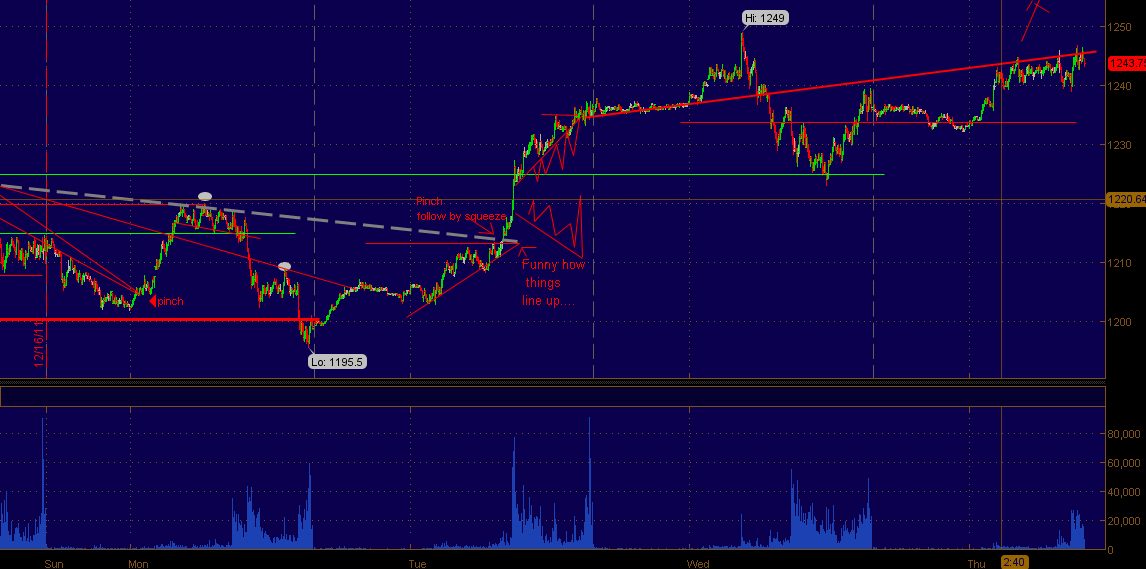
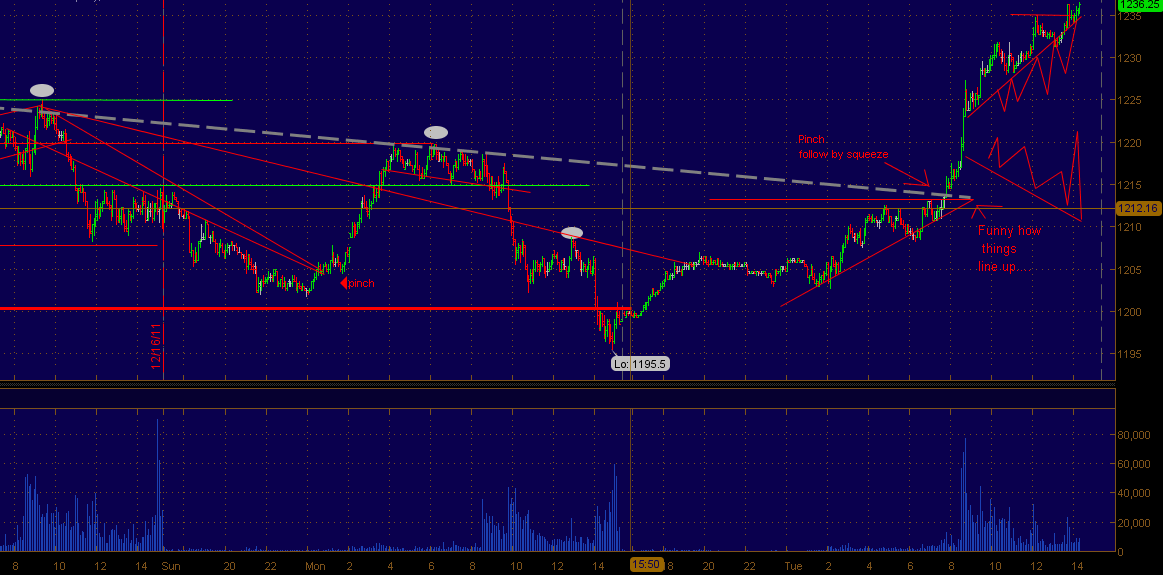
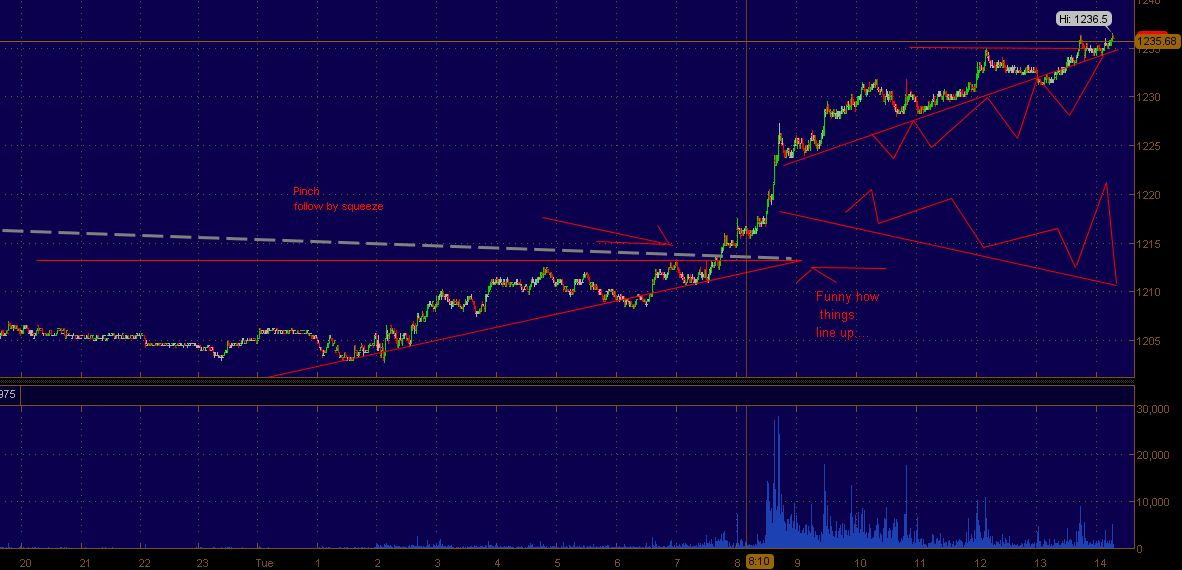
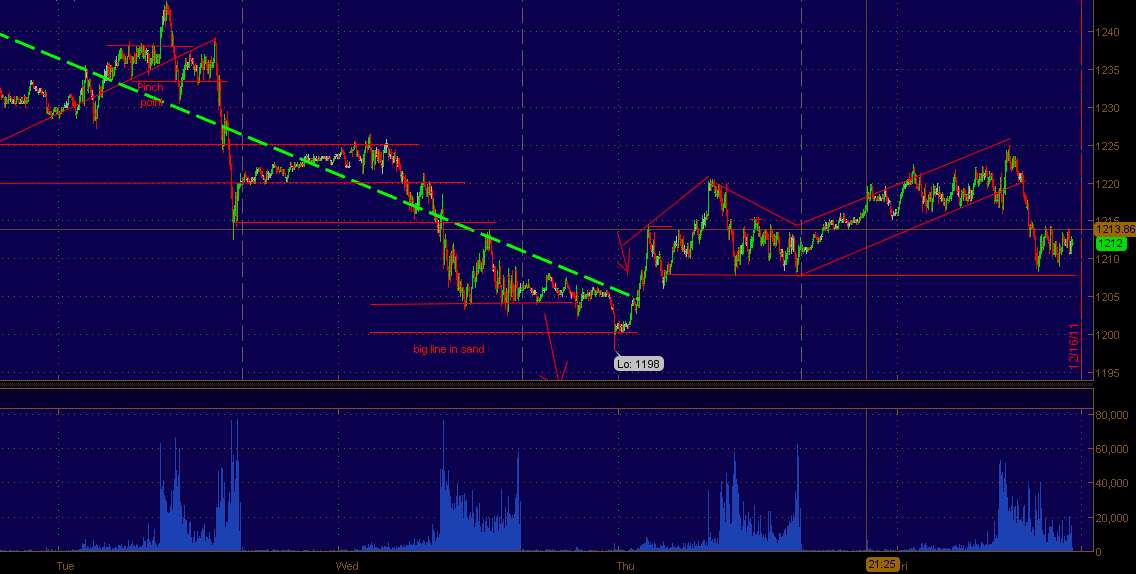
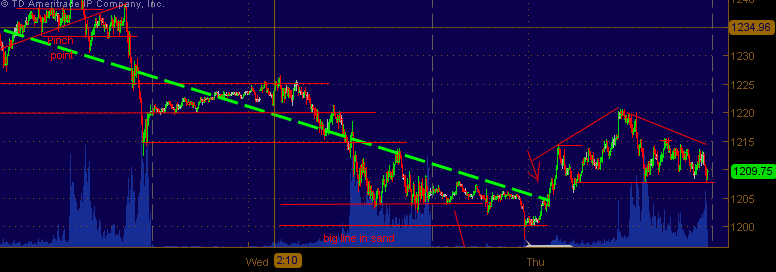
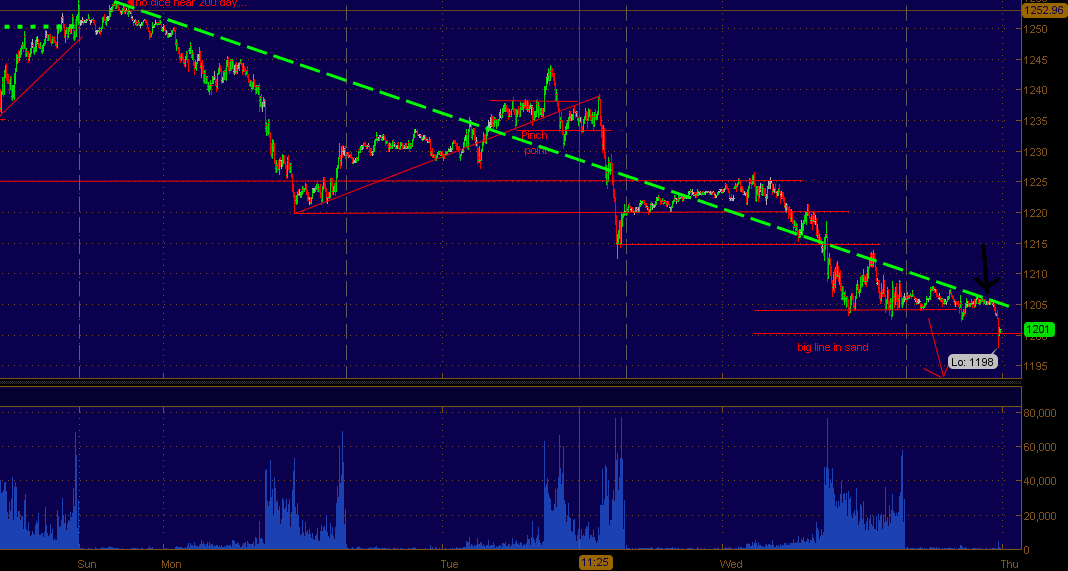
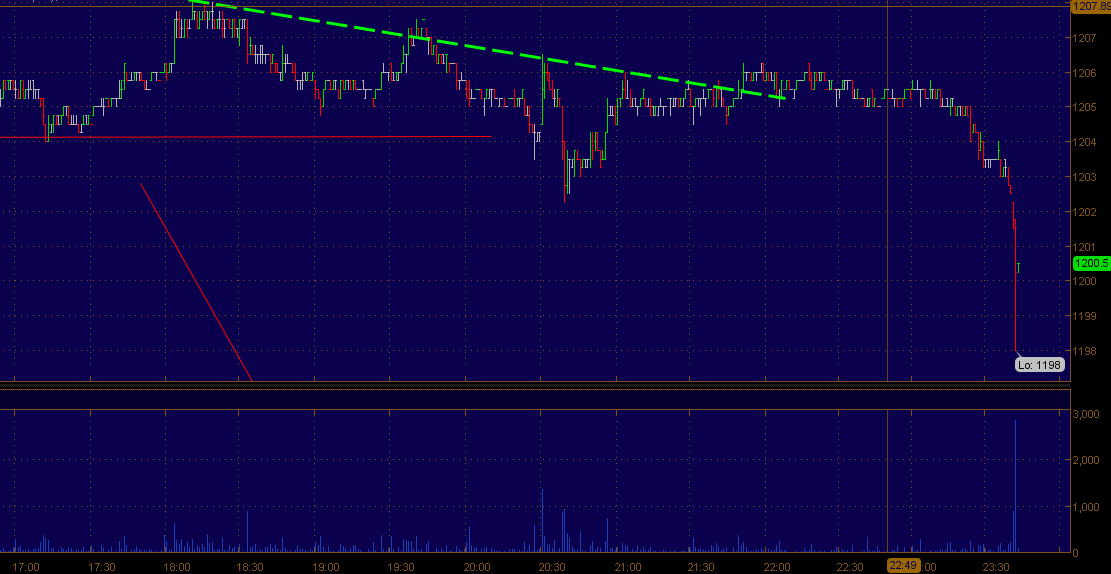
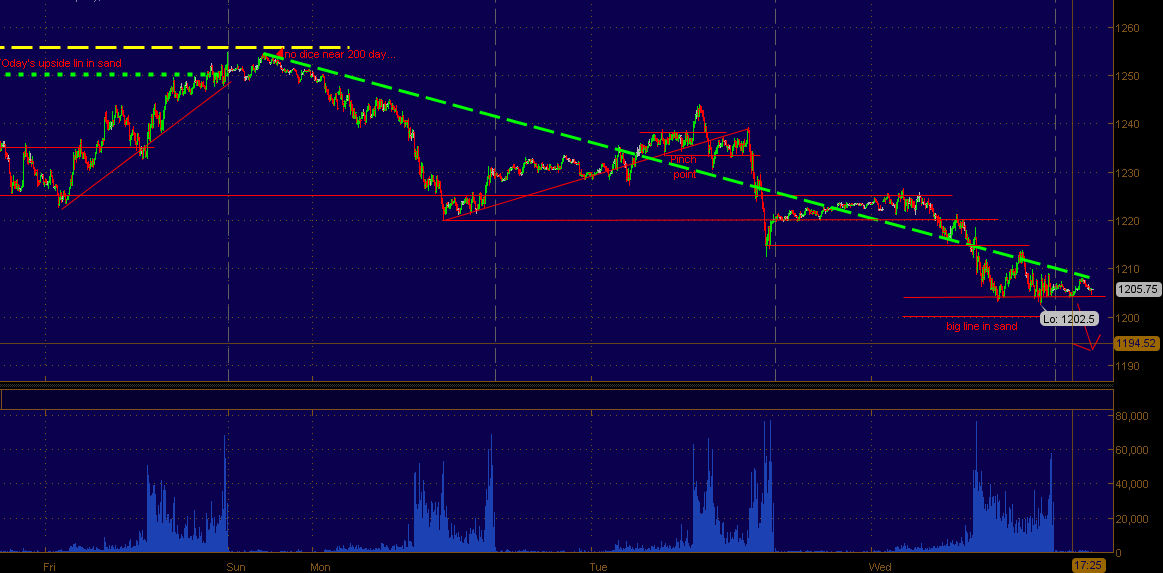
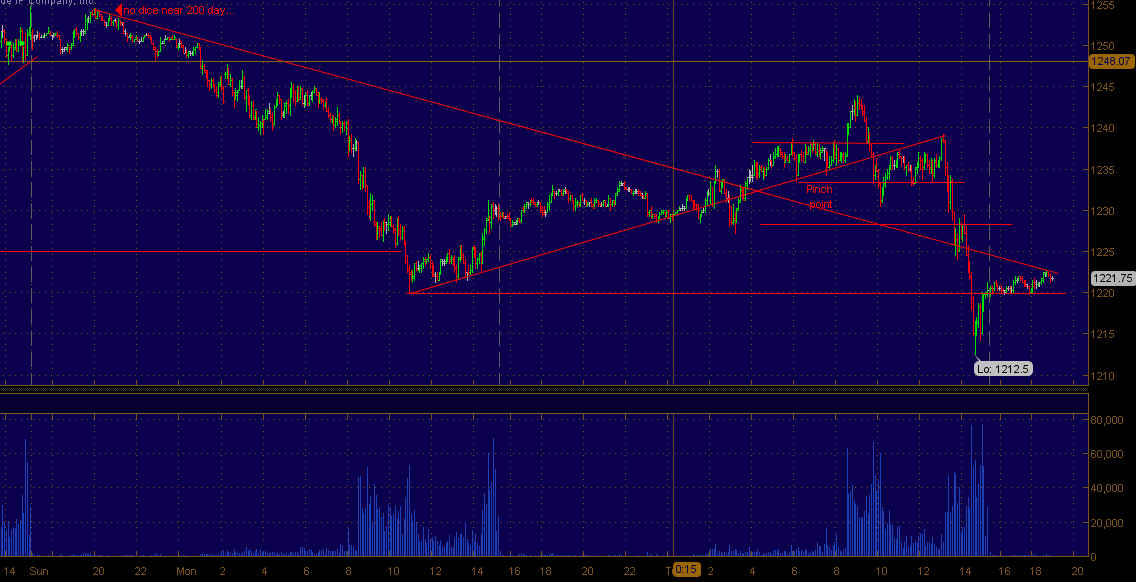
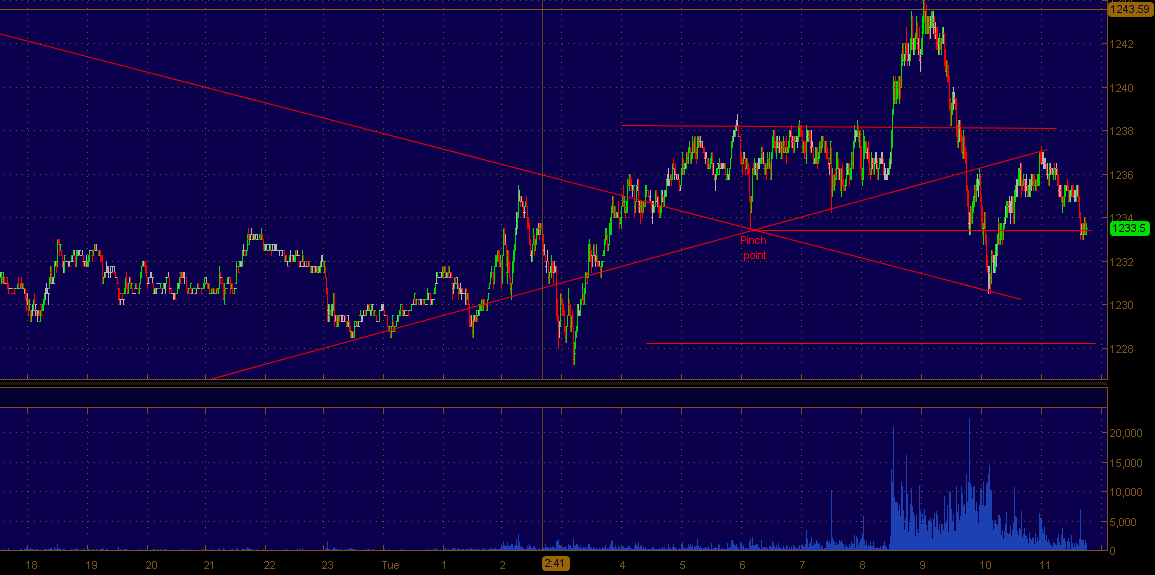
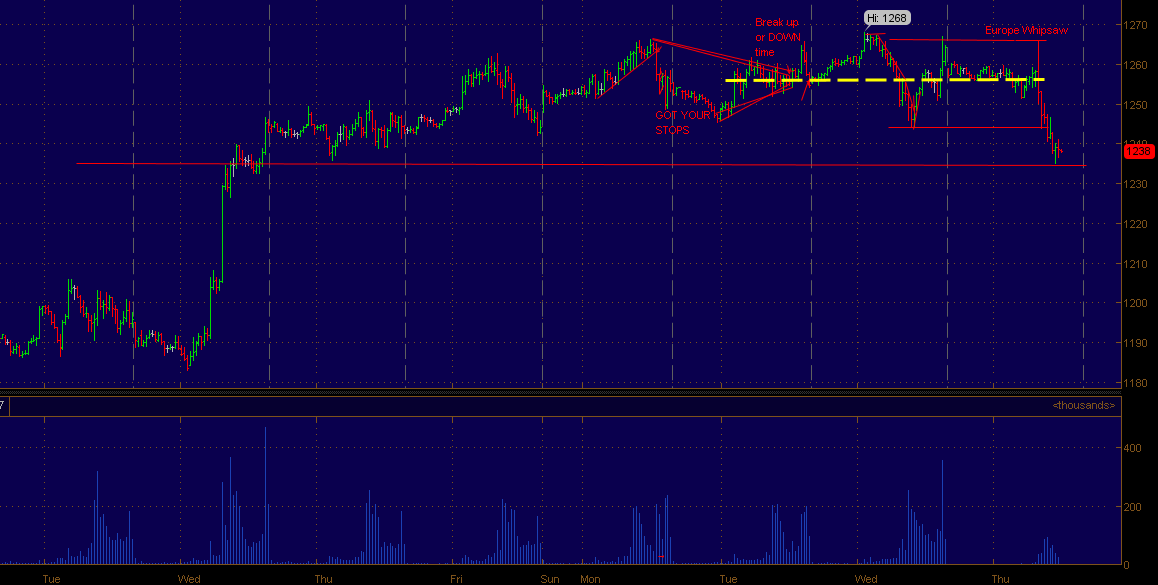
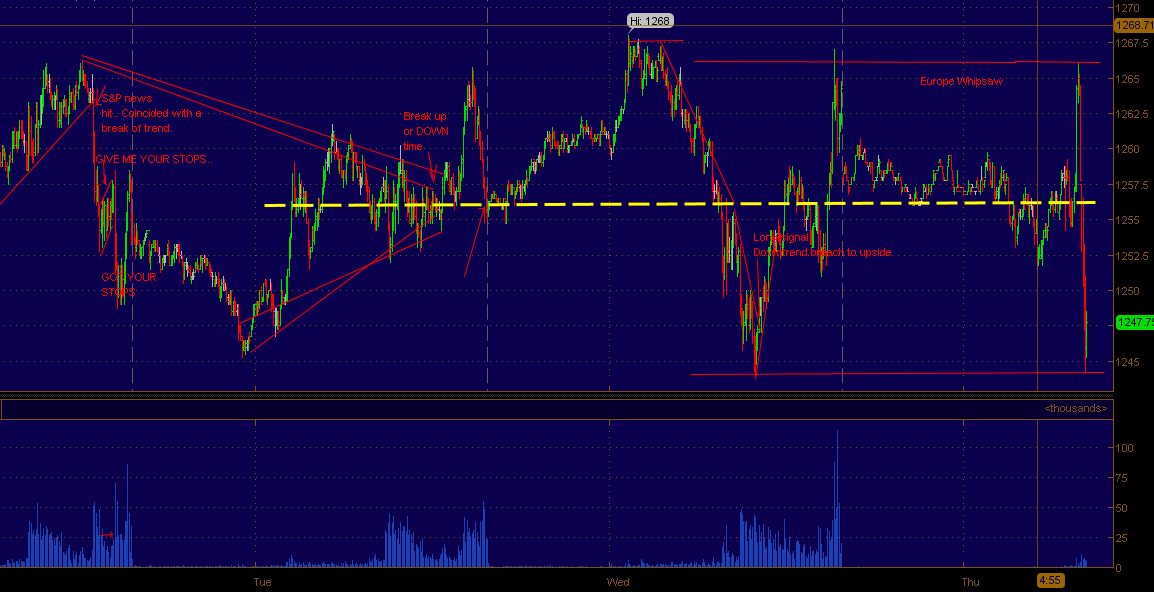
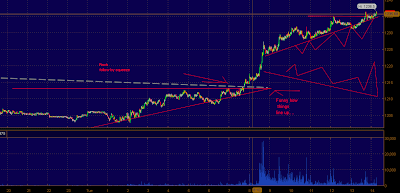
The squeeze trigger point for much of the short covering today was the break over 1214 about an hour before cash opened. You have a descending trend line converging with the apex of an ascending triangle, the machines love this.. and technicians. So you see what happened next. BOOM huge volume.. lots of shorts were stopped out as the downtrend line (grey dashed ) has been in place for about a week as the fall from 1260 commenced.

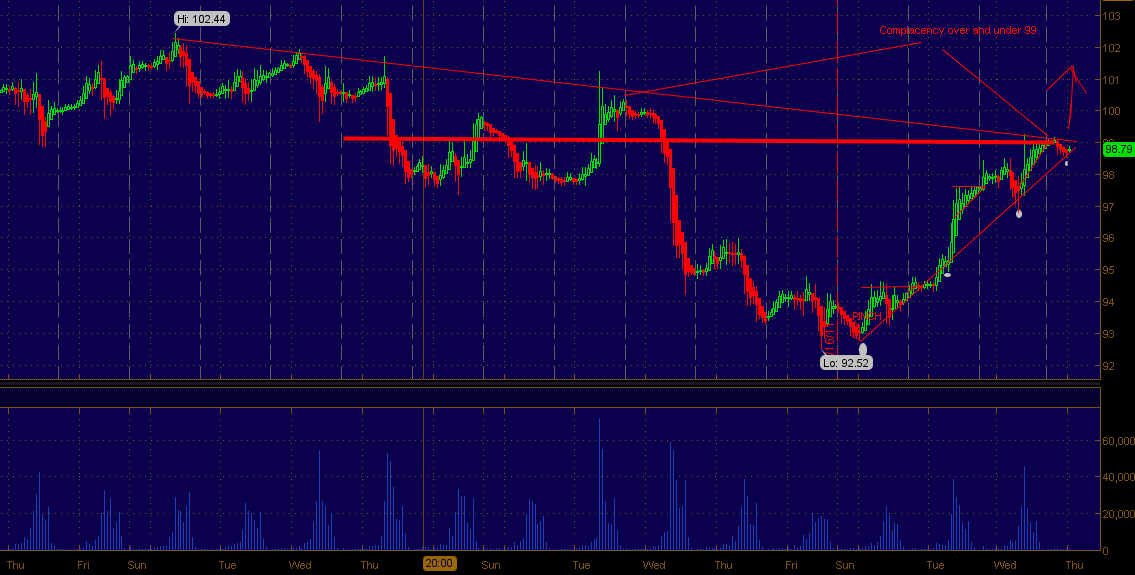
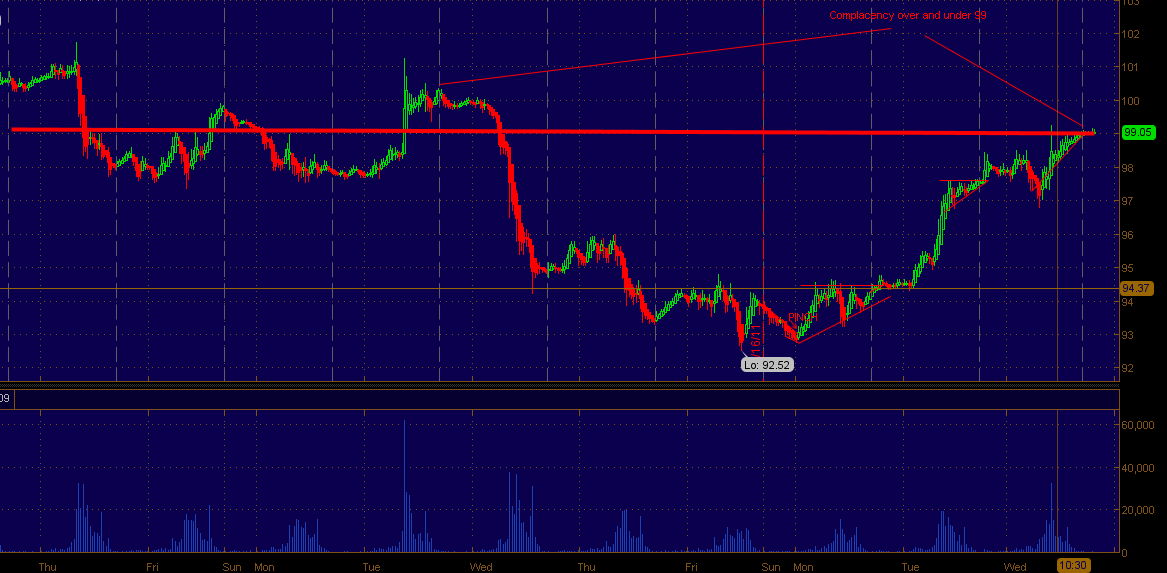
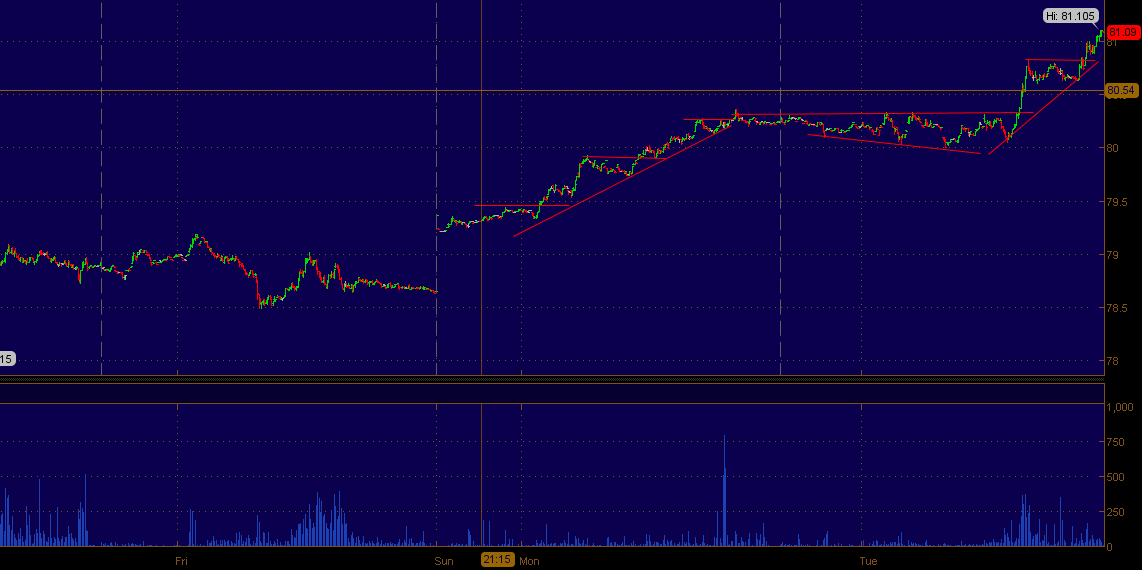
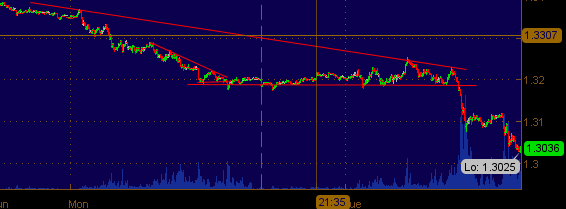
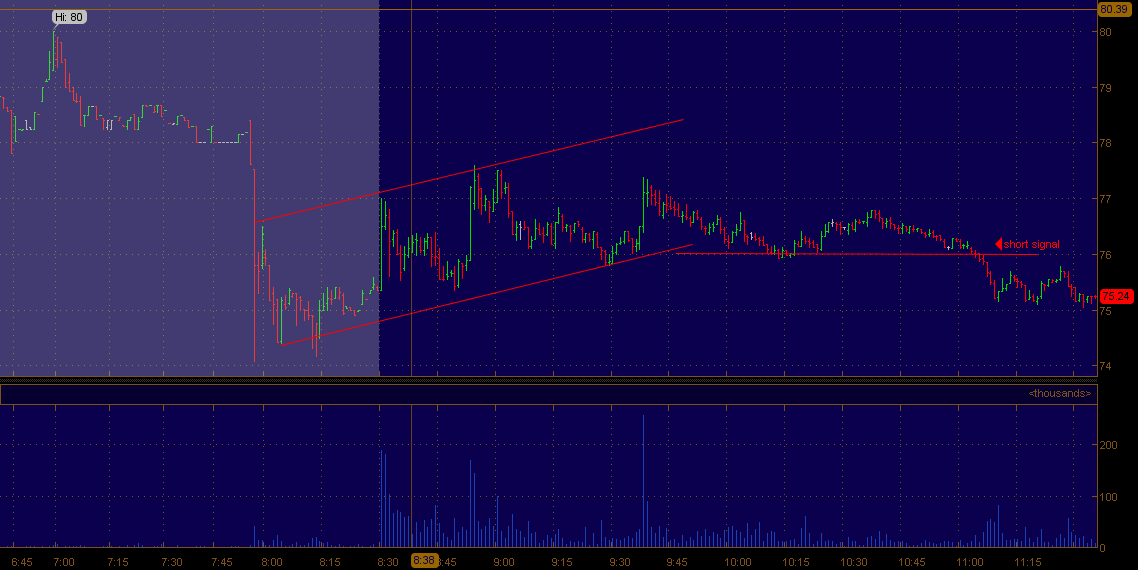
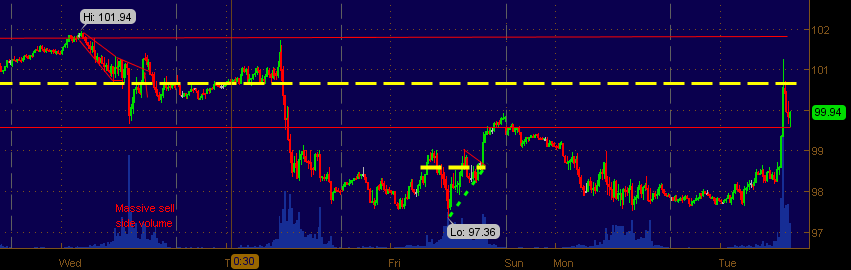
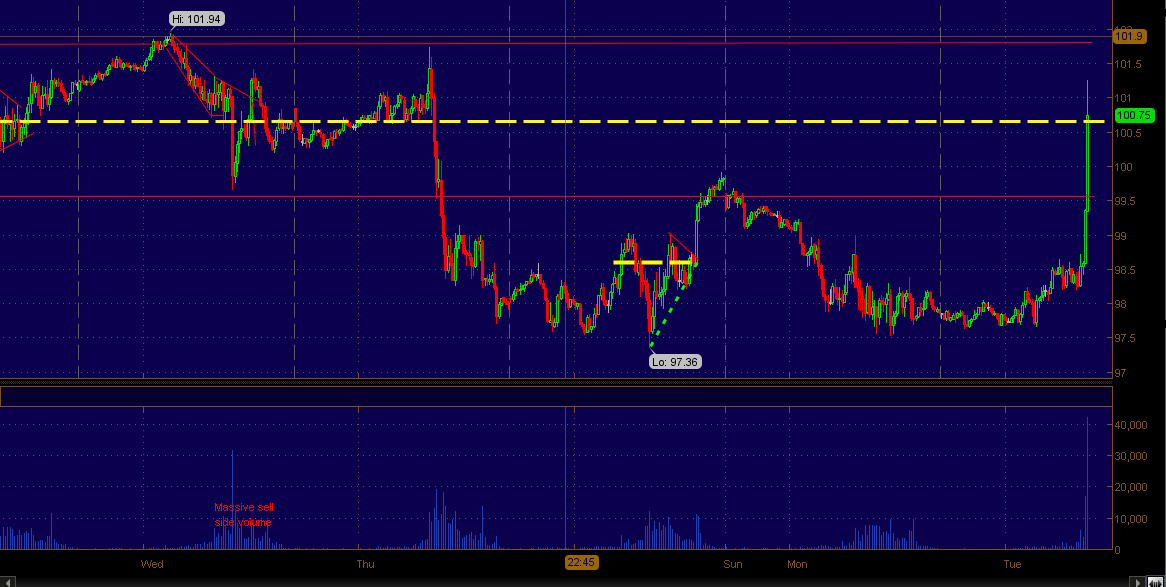
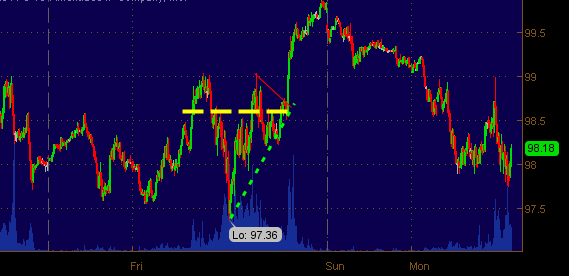
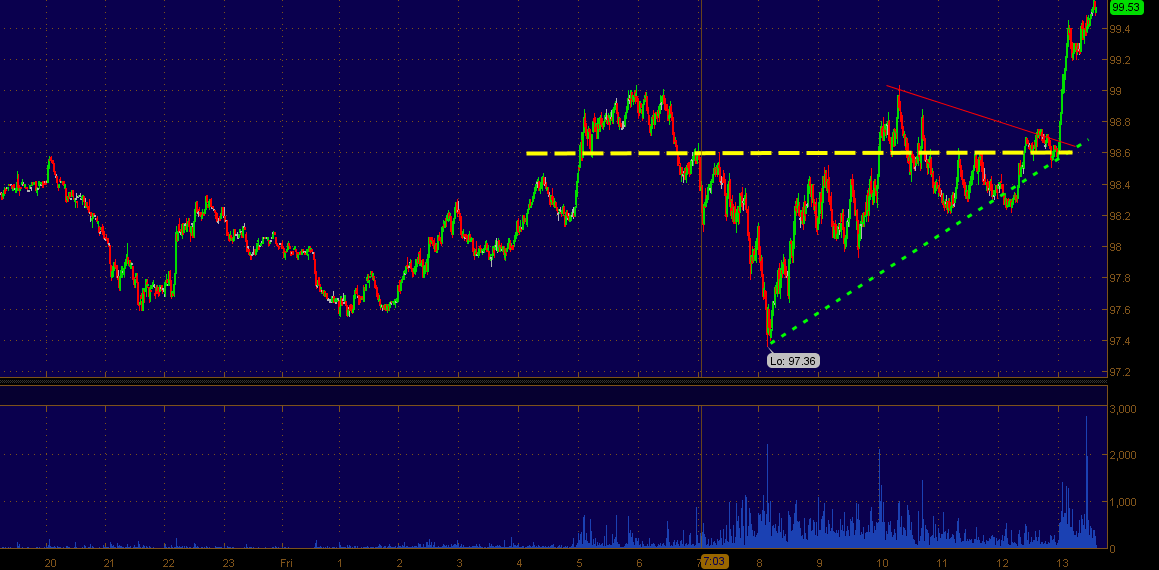
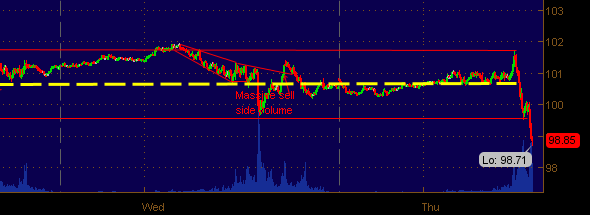
As far as currency's go, you have the euro bidding and the dollar off in a equal amount, very tame mind you. Crude has flown off the rails again and overshot to the upside some 3.6% further decoupling itself from the movements of the equity markets. I mentioned last night in my evening note on crude that i felt the risk was ot the upside and 95 would be trading before today. Sure enough 95 traded, and so did 97.50. You got 2.5 extra point. Win win.

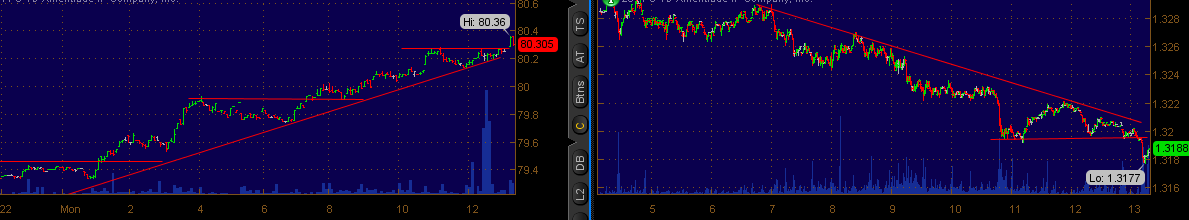
Gold as well as copper saw a rebound as well. Though what do you expect in a market tied together with hundreds of miss understood ETF's.

Add caption

Monday, December 19, 2011

West Texas Intermediate Crude Chart

5 min February CL 
Risk seems to the upside.. downside seems contained by a consistent buyer @ downside pivots... as you can see by the larger trend extending from the early morning low. Good chance 95 will be trading by the time Tuesday rolls over.

Myself and Talking S&P's and Tyson

Post Close S&P500 Index Charts & Thoughts (BAC)

5 min ES
The comical melt up this morning into 1220 was now in hindsight a gift from the market gods (hindsight yes, though fading was my idea from the get go) The bears took full control of the tape after 1220 failed and price sliced through 1210

Once the bears took control the day ended up being a barn burner in regards to price action... volume wise not so much. NYSE volume well under 1billion shares with most of this volume being done in the name BAC which broke the psychoTechnical level of 5. With BAC being a NYSE name and a heavily weighted component of the S&P when she falls through akey level the whole markets follows and sentiment quickly changes.

Kicking off the last hour WE saw this as the S&P futures break the 1200 level kicking out many sell stops down to the 1198.50 metric which indeed failed down to 1195.5.... Momo hard to stop when u have a big name like BAC and the XLF rolling.

My take on the rest of the week remains very technical with my ear to the squawk because headlines can move a holiday market very sharply as volume declines into Friday's half day. The 1200 level is very sticky, which means we may well chop around the metric until after the holidays are over. After today i expect some back and fill though if we see greater dollar upside we could break down into a 1180 1195 trading range heading into the new year. In the chart above you can see the support/resist pivots from previous consolidations within the large falling triangle have been lining up quite well.
30 min ES

Friday, December 16, 2011

Kilburg the Killir From the Nasdaq

Late Session S&P500 Futures Musing

5 min ES
 Same prices different week... happy friday..The S&P's have hung out over 1210 since early thursday morning gravitating to the 1210 level where a majority of the volume  yesterday and today was executed. The ES has remained ABOVE the hypotenuse (dashed line) break-over point @ 1205.50 for nearly 48 hours.

This info should tell you to keep this level in mind for support as well as a sell stop area below.

On the upside 1220-1225 is a level where sellers have been lurking and as stated above 1210 area for buyers.. to keep it simple you could wait for a break either over or below these two metrics to determine the trend for next week. The holding pattern has been solidified by a moderately quiet currency market the last two days, but remember never trust a dull market.

Thursday, December 15, 2011

Late Session Musings

5 min ES

1220 failed... 1210 holding... 1200 line in sand still in sights.... this reversal off lows could continue if we cross back over t 1220 during the post cash close seasonal melt up.

1205 Pinch Point S&P futures

5 min .. PINCH was 1205..

Sell stops were taken out under 1200 then reverse.. then EU headlines...boom squeeze.. 

Wednesday, December 14, 2011

1200 level in S&P500 Futures Breached

5 min ES 
1 min ES
She broke.. sell stops triggered.. 2800 contracts or so.. u see how it works..

Evening S&P500 Futures Note

5min ES
Notice the green dashed line.. provide a line of resistance and eagerness to huge the line.. A series of higher lows and lower lows have created quite a bit of pressure over 1200 and specifically the 1204 area where we could break down into 1200 very quick if it fails.

You can see the volume increasing each day this week as selling has accelerated during cash session. Below 1200 1290 is a level which could be come a pivotal area. Refer back to my previous note for more specifics on the currency markets.

IF the support holds around 1200 a reversal and buy stop area would be over 1210 in my opinion.. a break to the upside through hypotenuse of the descending triangle usually gets the bots excited.

Currency markets are quiet and near their cash close levels.. same with crude.. feels heavy under 95 ...

Mid Day S&P500 Futures Update


Another day another Euro low .. the low today broke the psychological and technical level of 1.3 which many traders look at as the point of no return..OR on the bull side look for an intervention if the pair dipped below 1.3...

THIS is not conspiracy the market has seen this in the past. Also you have to think about a lot of the macro funds out there who buy euro on dips, and this has been quite an epic dip. With crude down 6 percent trading down to 94.21 and equities off a percent a 3rd day in a row you have to ask yourself are we over done to the down side. Perhaps we are a bit oversold and the market does not go straight down or straight up expect some ebb and flow.

The 1200 level was defended in the ES.. the low was 1203.25, which above 1200 the ES still could remain resilient and naturally will want to bounce and or chop around consolidating after the down move from 1265's. IF you refer back to my video earlier this month i talked about liking the ES long on a close and hold over 1265ish, this never happened even though we did trade 1268. Technical's aligning with headlines is the them..

As for the rest of the day watch the 1203.25 level, if it fails we will see 1200.. below 1200 sell stops.. if the dollar falls off and the euro bids equity bulls could push us back over 1210 before the close. Though pressure seems to be on the downside still.

Jeff Kilburg & myself on The CMZ talking Euro, S&P's (OFF)

Tuesday, December 13, 2011

Evening S&P500 Future Chart

5 min ES
Fairly interesting afternoon session post Fed decision., interesting because of the lack of QE talk by the fed... Which is good... as Kudlow said tonight "tough"... DX futures greeted the fed with 11 month highs over 81.10 and the Euro tumbled to 1.3025.

As the dollar rose/euro fell equities came under pressure as they historically (last 3 years) do when we see the currency markets moving based on monetary policy concerns. The ES traded up to 1244 and failed down to 1231sh before catching the standard mid morning bid which failed on resistance of the acute triangle hypotenuse @ 1239.25. Bidders walked away after this fail, which coincided with a disappointing Fed quantitatively speaking. (headlines aligning with technical's recurring them). Post fed ES failed down to 1212.50... a nearly 33 handle sell off from highs.. VIX came off lows but did not show green on the day. perhaps because this is another intra-day trough to trough move much glazed over by the mainstream media and home gamers.

I am all for a stronger dollar, the safe haven is dollar and US treasuries.. proof in the auction and price action in the dollar the last few weeks.

Crude appears heavy if 99.80 fails..... If the ES breaks over the descending trend line in place from 1255 which is currently 1221 we could see a melt up to 1230 which would be a test of intra-day fail support.

We break below 1219 could mean we test regular session lows... keep eye on the euro 1.3025 level ... 1.31 resistance..

US Dollar Futures Update (UUP)

DX on 11 month highs.. last time it was this hi was early FEB 2011.
5 min DX
5 min euro .. big descending triangle 

S&P500 Pinch Point

1 min ES.. 1233.50 interesting level.......

Volume/price spikes in $NFLX each over the 76 level this morning (NFLX)

1 min NFLX
worth noting the 76 level.

Mid Morning S&P500 Futures Chart

5 min ES
Well well well.. quite the morning we have had, we came in green and quiet then all hell broke loose as crude started bidding in 20 spurts without any fresh catalyst. The lack of catalyst was short lived as a rumor the straight of hormuz was closed by Iran for a pre scheduled military exercise. This smelled of BS from the get go as crude offers were lifting a dollar at time, highs were faded from 101.25 down to below 100. Which was justified as a mid east news agency came out 1 hour post fade stating the straight is open.

As for equities we they followed crude higher into 1244's before fading like a rock once the arbitrages realized they were holding a bag of crap. Sure enough headlines once again align with technical's as Merkel states she was not going to raise the ceiling on the ESM bailout.. this send the EURO to fresh month lows and the dollar into nearly 11 month high of over 80.83. the ES found a bid down around 1230 as euro sellers and dollar buyers were exhausted for the time being. once the big driver trade stops pushing equities begin their pre programmed melt up .

STRAIGHTS OF HORMUZ Closed for 'exercises' *rumor

Notice where crude pivoted.. bottom support of channel 99.60.. chart lines from previous day 4 reference
15 min CL
Back in the 99.49 101.49 channel... hmmmm
Crude oil goes vertical

Monday, December 12, 2011

Afternoon Euro/Dollar Chart Update (UUP)

1 min DX/6E
You can see from the chart on the left (dollar) huge buyer came in around the 80.29 level, about 1300 contracts in a 3 min period traded. This makes this level one to watch for the future. As for the euro the 1.3222 low did not hold and we have yet to get any major headlines or interventions out of euro.. which is good. for the bears...

Mid Morning S&P500 Futures Chart

5 min ES
1230 failed with a bit of volume, 1225 next support... resistance 1235 if 1230 trades on a bounce.

The dollar strength/euro weakness is leading the show.. 1.3222 is the euro low for this morning....

notice how the ES failed right under 1255, which was the mid line of the channel formed mid last week.

Morning WTI Crude Chart Update (USO)

5 min 
97.50 hard support... this is where we pivoted friday hard in the morning and raced up 2 points.. Notice the pinch break out @ 99.50 (yellow dotted line) friday.. nearly perfect technical break out.. the momentum only worked for a short while....

With the Euro clear under 1.33 and the DX flirting with 80 you can be headline risk is huge out of europe as ell as pressure on equities will be firm.

Friday, December 9, 2011

Post Pit Close Crude Chart (USO)

1 min
Nice bounce in CL off of support (yellow line) which coincided with a break of the pennant to the upside. Extremely coordinated and violent spike up to 99.50 was quite funny on a friday.. Perhaps more Iran talk this weekend, because as you know all the big news comes out sunday evening. Your week starts sunday afternoon, not monday morning.

Mid Day S&P500 Futures Update

30 min ES
ZZZ.. all the action was in the overnight/euro/asia session once again.. with the roll coming up 12/14-16 the volume is a bit skewed between DEC and MARCH contracts. anyway on the DEC contract i am watching for a trade over 1255 to trigger some friday buy stops.. below 1255 we may fade down to the uptrend line.. but the big green dotted line is the definitive line in the sand. this line coincides with support from previous days this week. Digestions day. and again the market is resilient though volume is not.

5 min ES

Thursday, December 8, 2011

Post Cash Close S&P500 Chart

It got ugly....
5 min ES
The lines tell the story... been in place all day.

Pre Close S&P500 1 min Chart

test of ES lows twice held... notice down trend... some bottom picking going on ...

Vix Volatility Report For Thursday (VIX)

Mid Day S&P500 Futures Update

30 min ES
The low of the MARCH contract 1235 coincides with the SHELF which the index was placed on post ECB IMF BS financial times rumor. below this 1235 level in march and 1240 level in December we have a lot of air down to 1220.

notice the failure of the index to break over the almighty 200 day @ the 1266 level. Lots of sideways movement with big intra day swings. mainly in the overnight..

This Morning's WTI Crude Chart

5  min .... 99.50 failed into 98.71.. market is violent..
5 min CL 
101.50 to 99.50 ... quite a range.. mirroring the ES.. as the dollar surges oil goes lower. still though like equities crude is now in a giant range.... very similar price action to yesterday morning... "indecision"

Pre Cash Open S&P500 Futures Chart

5 min 
Talk about whipsaw.. the 1265 - 1245 channel is still in play from yesterday. Every day this week we have seen the SPU trade between these two prices each day taking less and less time to between trades on 1265 and 1245. Today it happened in minutes not hours. WE should see some buying off the 1245 level.. though if it fails upon cash open we could woosh lower as sell stops are triggered.

Europe nothing has been solved."lending money to IMF to buy Euro bonds is not compatible with the treaty" Because of this the commodity market is still a slave to the currency markets as well as equities. Crude moved wildly down from over 101.5 to down below 100.50 while the dollar surged higher almost to 79. Same games different day.. trade accordingly.

Wednesday, December 7, 2011

E.S.P European Summit Premium on VIX

Mid Day CL Update (USO)

1 min CL - 
Roller coaster... over 101.50 we could see some buying come in as the price is chased over morning highs and the ledge at which is fell into the 99.67 area.

Newer Posts Older Posts Home