
|
| GC_F 5 in |
5 hours ago


|
| 4hour |

|
| 15 min |
|
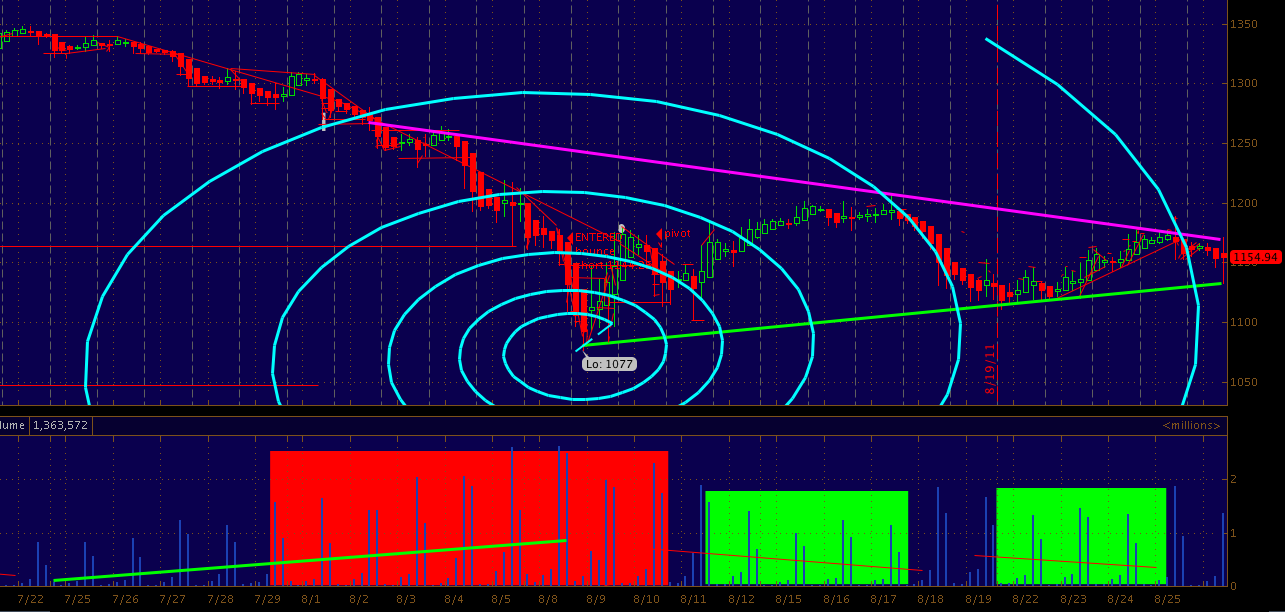
| This chart is fairly self explanatory... what i want you to focus on is the FIB Fan in Blue and the subsequent pivot points within the trend (pre and post 1077) also focus on the subsequent wedge formation pivots in relation to the volume profile at bottom.. GREEN highlighted volume graphs are on green days.. red obviously were down days with 2x the volume. What is to come tomorrow? Trade what you see. |
|
| 5 min |


|
| 1 min GC |
|
| GLD 5 min showing all time high |

|
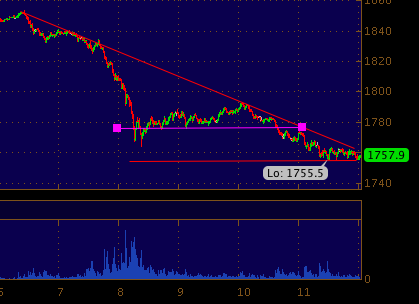
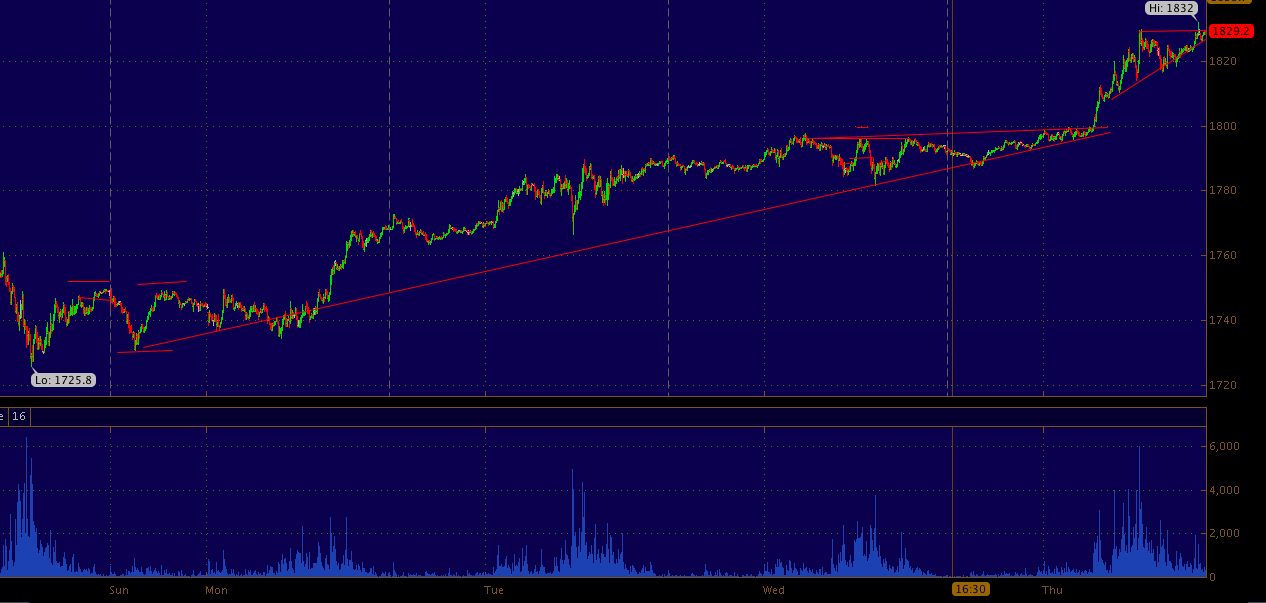
| 5 min GC showing all time high and now 103 points lower 1755.5 print |
|
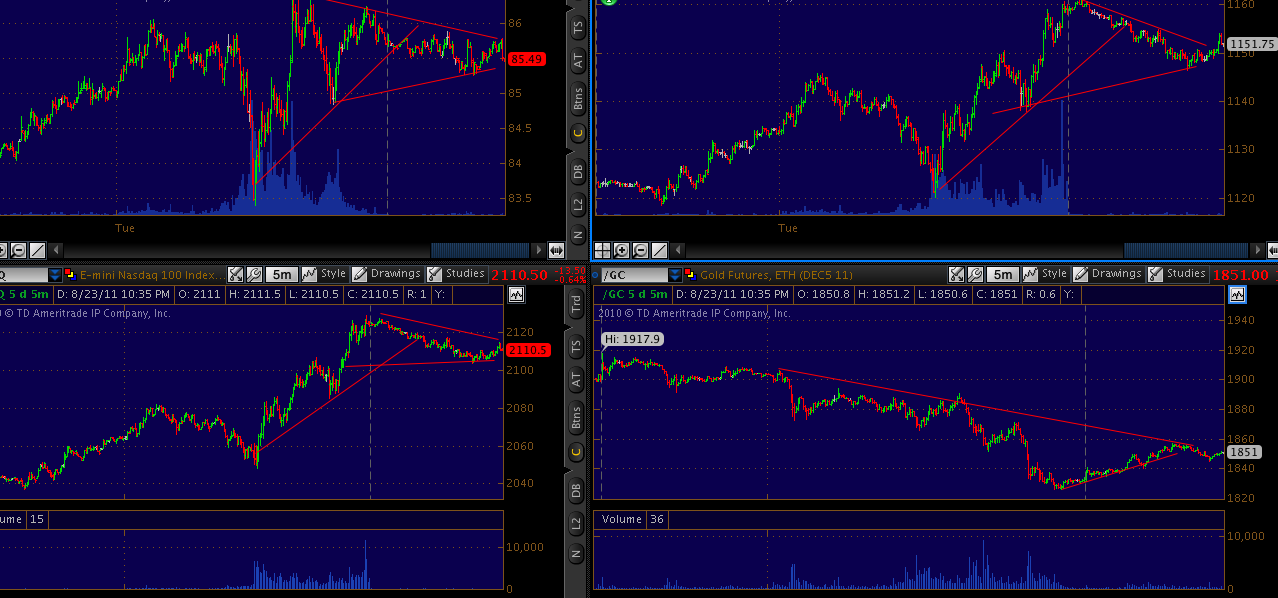
| starting @ top left clockwise you have 5 min CL_F , ES_F NQ_F and the all mighty GC_F you can see clearly uptrends have been compromised which the index's and crude followed.. and GOLD is fighting to break over the downtrend line you see clearly in place from 1900... the ES_F popped up out of the apex of the wedge @ 1150 ... the shenanigans start!. |
|
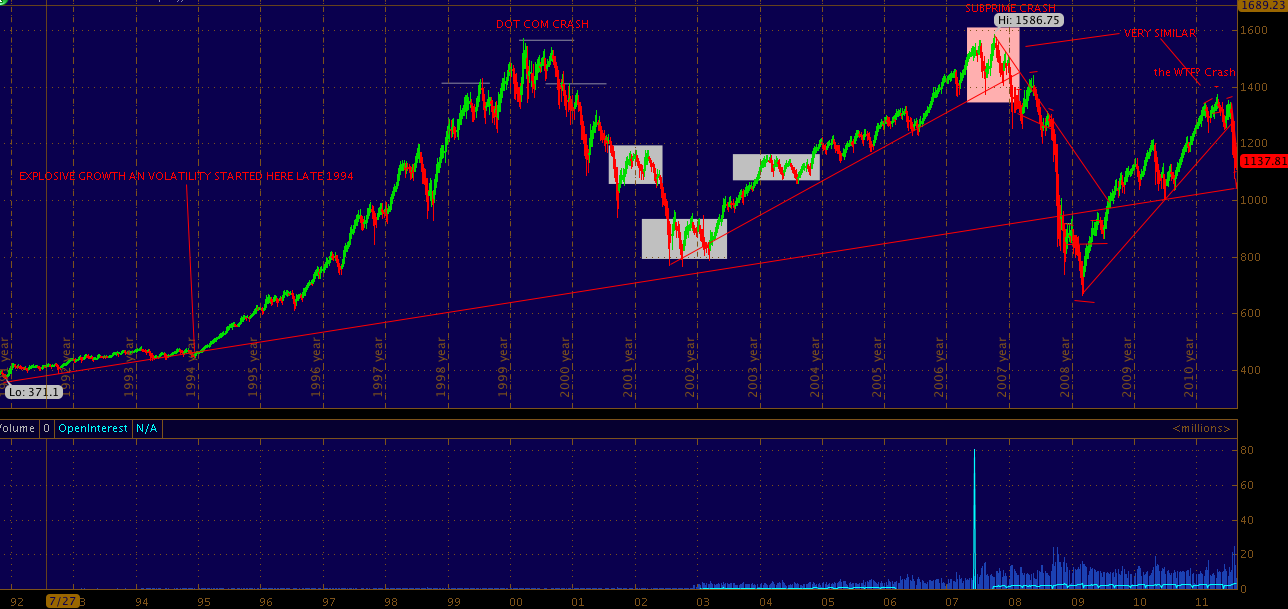
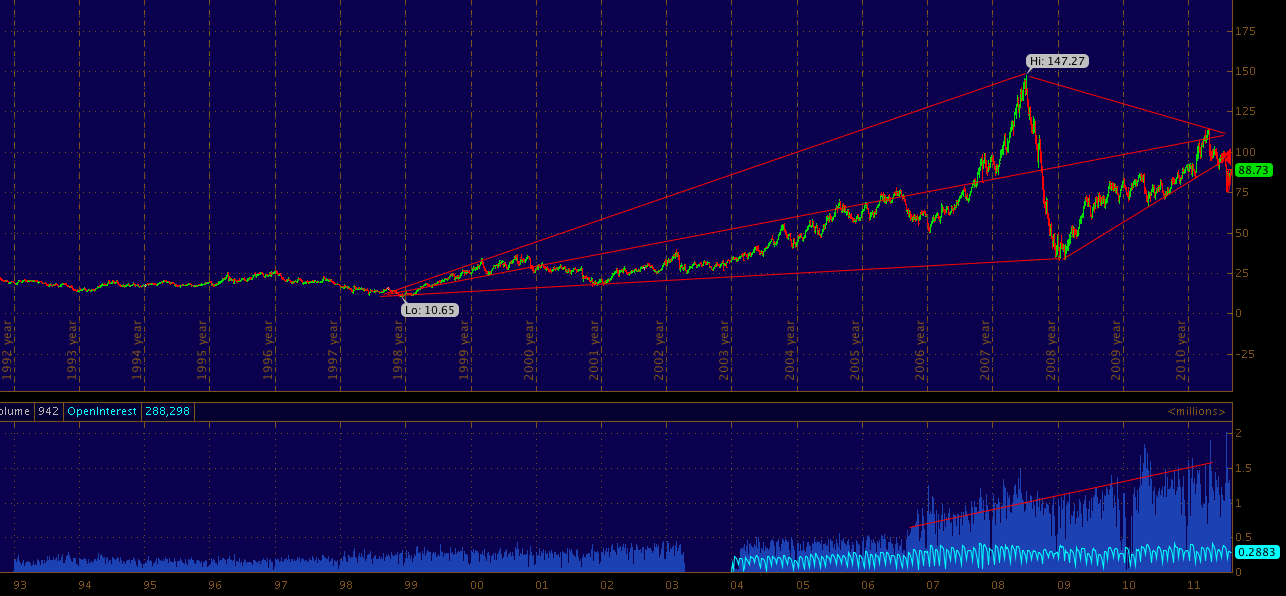
| 20 year weekly candles 1992 to present.. What makes this chart very interesting is the up-trending line which has was defended in 1992, 1994, 1995, 2002 FAILED in 2008 & 2009 BUT defended again in mid 2010 and perhaps now in mid 2011.... |

White-Collar Criminal DefenseMr. Weingarten represents clients in complex criminal matters in both state and federal courts at the pre-trial, trial, and post-trial stages, including cases involving public corruption, the Racketeer Influenced and Corrupt Organizations Act, bank fraud, bribery, government procurement fraud, antitrust, healthcare fraud, and tax and securities fraud.

|
| GS 1 hour. notice descending triangle break down under 110 . previous descending triangle break down was @ 128 |

|
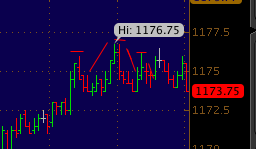
| 1 min |

|
| NQ 1 min |

|
| 5 min SPU |

|
| crude 1 min. 83 previous support now resistance. |
|
| YM 5 min |

|
| monthly NFLX |

|
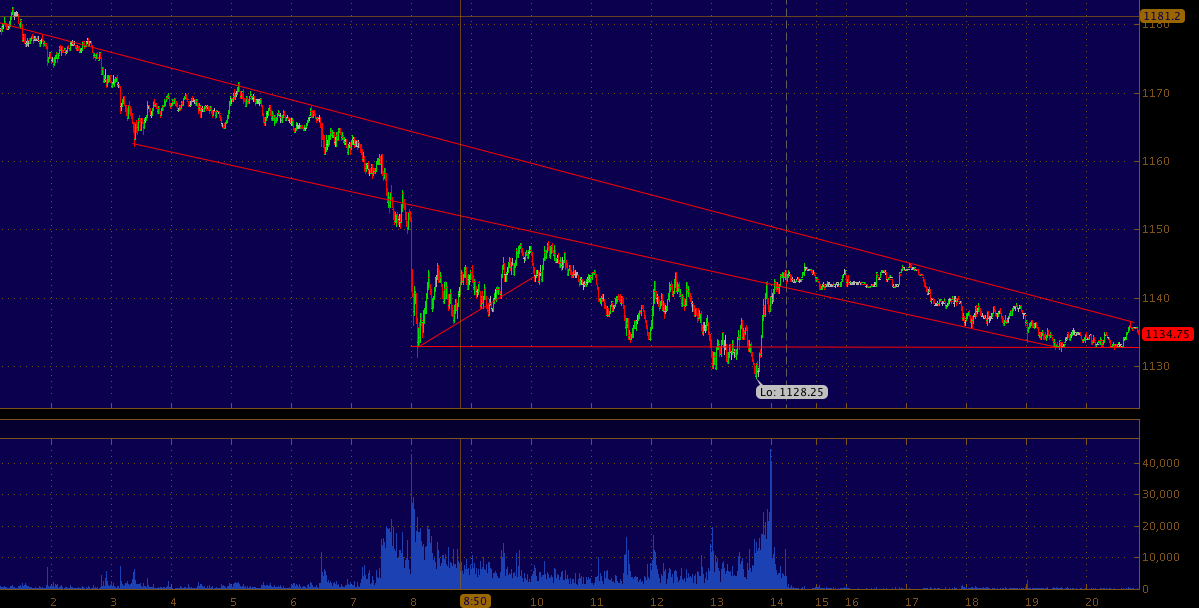
| DAILY |

|
| daily bars SPU or on twitter known as the ES_F |

|
| 5 min ES_F |

|
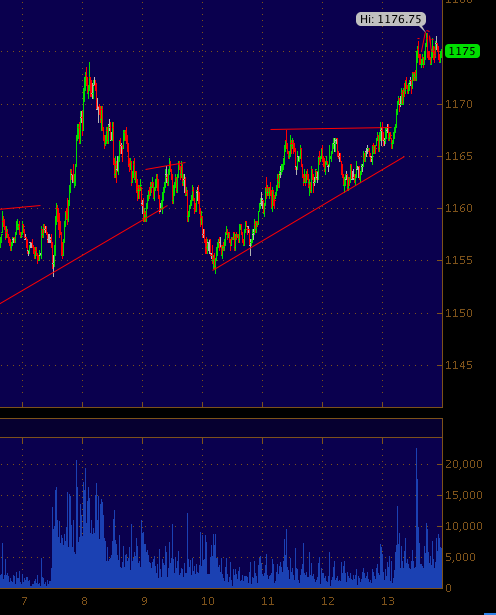
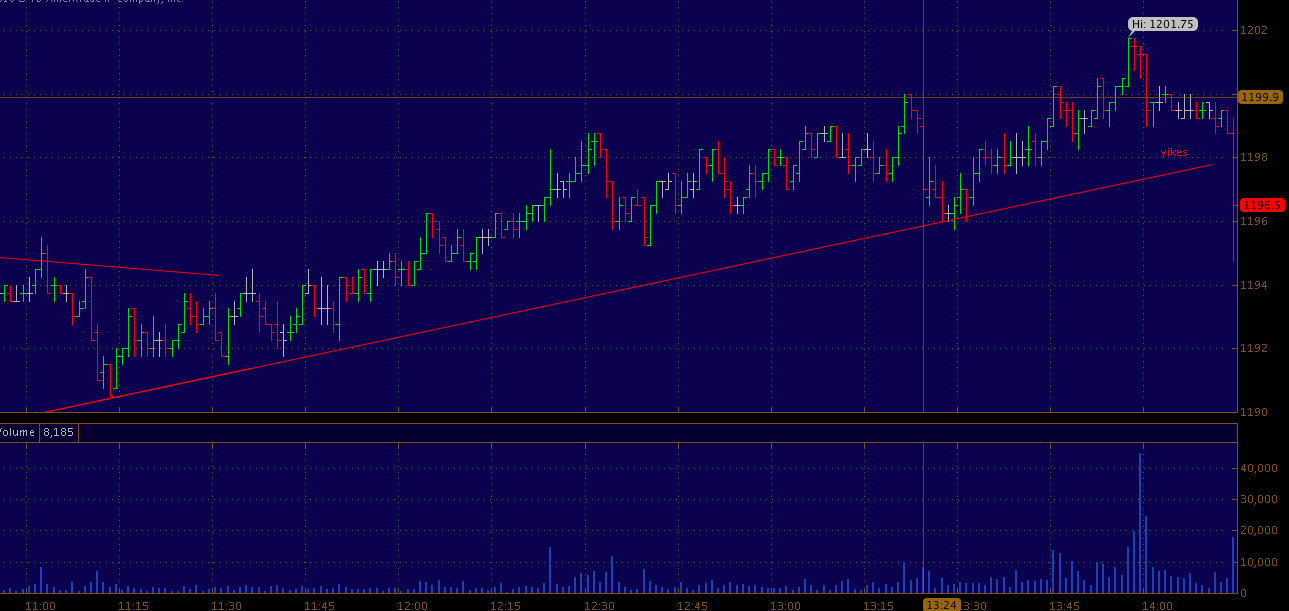
| ES 1 min |
|
| NQ 5 min |

|
| CL, ES, NQ, GC |

|
| CL, ES, NQ, 6E |

|
| ES 1 min |


