Thursday, September 27, 2012

Italian Prime Minister Mario Monti speaks with Bloomberg TV about the European Debt Crisis

Mario Monti, Prime Minister of Italy, spoke with Bloomberg Television’s Erik Schatzker in New York today about considering another term after elections.  He discussed why the EU’s new bailout fund hasn’t been used yet, saying “because it is being finalized. And in particular I think there is still some refinement ongoing on the precise nature and modalities of the conditionality that would have to be associated to the European Central Bank intervening in the markets to buy the bonds of a specific country.”

Monti's biggest fear: 
“It is a non-economical fear that is that the political leaders of Europe, among them temporarily I found myself, but that the political leaders of Europe do not involve enough attention to coping with the increasing resentments of one country vis-a-vis another country of the increasing attitude of nationalism, the many backlashes against integration that are there. This is partly a paradox.”   
and goes on to say:

“This is partly the outcome of the tensions within the Eurozone and we must be very, very careful to avoid that the euro, which is the most advanced substantively and symbolically element of the European construction, might end up bringing with it as a byproduct some disunion, some disintegration through the psychologies and the politics of the different countries. I think it will be important yes to continue to work on the stabilization mechanisms and so on and so forth, but looking clearly and directly these issues which may require a great political attention.”

Source: Bloomberg TV

Via @BloombergTV

Tuesday, September 25, 2012

Bloomberg economist believes a mild recession coming in 2013

Bloomberg economist Joe Brusuelas writes that the fiscal cliff poses a "significant risk" to U.S. outlook.

Brusuelas writes, "The current Bloomberg consensus forecast is for a growth rate of 2 percent in 2013, with 1.9 and 2.3 percent rates of expansion in the first two quarters of next year. Should Congress delay acting until early 2013 to address [fiscal cliff] issues, growth will likely slow to less than 1 percent during the first half of the year. Persistence of financial gridlock would probably push the economy into recession in the first half of 2013."


Top findings from the Fiscal Cliff Bloomberg Brief include:

·         ECONOMIC IMPACT:  The economic impact of permitting the combined tax and spending measures to expire is stark…The result will be higher unemployment, falling taxable income and a mild recession in early 2013

·         FISCAL PATH:  Government spending will need to be brought into alignment with revenues over the next several years to bring the primary budget into balance and to stabilize the long-term debt of the U.S…Currently, the federal government is running a primary deficit of roughly 6 percent of GDP. Nominal growth over the past year is roughly 3.9 percent and long-term borrowing costs are about 1.5 percent. Assuming these levels, the federal government would be able to run a primary budget deficit around 3 percent and stabilize the debt-to-GDP ratio at near 100 percent. This implies that in coming years, the government would have to pare back annual spending by about $500 billion to accomplish these goals. …An increase in interest rates would require even more restraint in non-discretionary, defense and entitlement spending.

·         POLICY BRINKMANSHIP: Given political polarization, these issues may well not be addressed until the start of the 113th Congress on January 3, 2013.

·         FISCAL CLIFF AND THE FED: It is probably that the Fed will use its Dec 12 meeting of the FOMC to announce, at a minimum, that it will lengthen its maturity extension program to help mitigate the effects of a shock to the economy should lawmakers fail to resolve the fiscal cliff.  Should the outcome of the upcoming election be further polarization in Washington…the Fed may entertain the idea of another round of unsterilized long-term Treasury purchases to complement its open-ended mortgage-backed security acquisitions. A failure by policy makers to address the fiscal cliff of 2012 may provide an opportunity for fixed income investors to profit well in advance of the beginning of next year.

via Bloomberg BRIEF Economics
Follow Joe on Twitter at 

from

Wednesday, September 19, 2012

4 hour $CL_F Chart Post 97.50 Failure - $USO

The macro trend from the May lows of just under 78 a BBL failed at 97.50 Monday resulting in a stop run into 95 followed by a failure of 94 today resulting in a 91.55 low Wednesday. Seems a bit to easy to tip a billion dollar market on its side just because you can...??
4 hour CL_F

A 15 min look at the $ES_F Chart - $SPX

channel'ing - a break below 1449.75 or break over 1458 will dictate the next leg of trend..
15 min ES_F

Friday, September 14, 2012

Interesting Market color from $JPM -


weekly SPX
 Below is an excerpt from a JPM weekly report which came out after the close. have a good weekend.
"How I Learned to Stop Worrying and Love the Rally – stocks sprinted higher this week, extending the very impressive rally and leaving most major global indices sitting at multi-year highs.  The big catalyst behind the move was the Fed but Bernanke really as just one piece of a continuum of events that have contributed to the very strong price action.  Keep in mind the S&P had ripped 100 pts even before the Fed on Thurs, largely b/c of the impressive policy measures adopted in Europe (Bernanke arguably is just throwing fuel on an already large fire).  
Stepping back, the big tectonic drivers of this rally remain in place – falling tail risks (including and especially the ones in Europe), massive CB liquidity, improving US housing, and expanding multiples.  That is it.  All the other “negatives” aren’t irrelevant but they can’t compete (for now) with those other positive forces (this is why the warnings from FDX/INTC, the Libya events, surging crude, poor non-housing eco #s, sluggish China, etc, are being ignored).  
Sentiment is still a little weird – increasingly there is an expectation that stock prices will continue rallying but only b/c of central bank manipulation (so the average investor isn’t wildly bullish on fundamentals necessarily but acknowledges the power of central bank liquidity).   - Alessandro P. Garbuio JP Morgan Prime 

Thursday, September 13, 2012

Jeffrey Gundlach Says: Stocks Won't Repeat Lost Decade

Gundlach is very intelligent and calmly spoken. his points on buying bonds just for capital appreciation leaves one open to missing out on other opportunities such as buying Facebook and selling it every time it goes up 4 percent. Of course this is just one example of what one could do, but it should tell you how these guys are indeed doing business in the stocks many of us love to hate. And its not "dumb  money" either.        Thinking outside the box is what puts profits in your pockets.

"natural gas is up 50% from when we last talked" - Gundlach

"I only buy facebook to trade it, just to prove a point that it is more rewarding than playing around in treasury bonds. Thats it." Gundlach 

Post FOMC meeting results $ES_F & $SPX charts

30 min SPX
Welp.. we got more twisting and shouting from the Fed to the tune of $40 billion a month .. the markets liked it.. 1450 printed in SPX an ES_F .. the RUT broke to her new 2012 highs as we expected here at hedge.ly.

 The 30 year bond fell off into 146'05 while gold soared past 1760.... patience.. Bernanke will explain himself at a presser in 45 min @ 2 pm ET.
15 min ES_F
Check out the Trade For Profit Forum so you never have to trade alone again.

Wednesday, September 12, 2012

New 2012 highs in the $ES_F post Apple Iphone 5 announcement

This post builds on a post from pre-Jackson Hole....

Asinine HFT induced and exacerbated chop almost blew the vacuum tubes out... but they didn't and the ES made a new high AFTER regular session closed (as usual) of 1440.25.

1432.75 was the last tail lower before the ES as well as Apple ripped to highs. Apple moved 12 points in the last hour. Currently is trading for 672 AH from 656 at 3:00 pm ET.

15 min ES_F
30 min ES_F

Tuesday, September 11, 2012

A Weekly and Hourly look at the $RUT - Russell 2000

weekly RUT
US equity indexes meandered higher while the VIX climbed  ahead of the German vote on whether or not the country will contribute to the ECB bailout fund as well as the beginning the two day FOMC meeting tomorrow. (my take on the VIX action is managers are locking in profits from the recent run up as well as shoring up hedges as we sit on 5 years highs)

That being said you have to ask yourself what is your plan ahead of tomorrow and Thursday's FOMC results.... your plan must include ideas for a sell off and or a rally depending upon the news flow.

The recent Russell run up could very well be profits from the bond run up being put to work in speculative *more risky smaller cap companies in hopes the index as well as its components will catch up to the 5 years highs reached by the SPX and NDX last week. If this is the case and the index does make a new high for the year you should be cautious because speculative capital is fast capital.

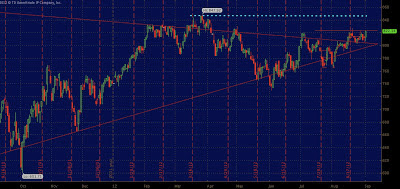
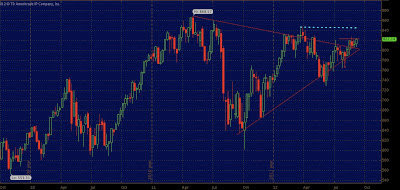
When looking at the Russell 2000 chart above, the blue dotted line is clear resistance at the 2012 high of 847.92 with support at 835.55 then 823.30 (redline). The red line is also level which the index gapped over Thursday morning following the Jackson Hole conference speech by Ben Bernanke.
1 hour RUT

Thoughts on the $SPX and $ES_F Charts

30 min SPX- showing inverse H&S formed fri-wed of last week
The 1420-38.75 level in the ES as well as the SPX will more likely be the range until the early hours of tomorrow. Above 25 if we break over highs, clearly 1440 is the first line of defense for sellers, above is air into 1450.

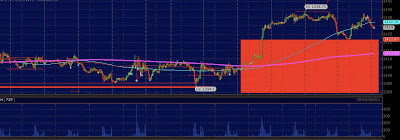
Below 1420 means the price could enter the red box highlighted below and in theory could fall easily to the breakout level of 1290-1400 if the Fed and or German courts disappoints wed and or thursday.

Quite a few participants are long only and are very long though in my opinion many participants are short and or have not participated in the last 100 points of the S&P because of complacency and or skepticism. A fire burns hot, but when the fire is fanned it becomes white hot. A squeeze related to fed action could fan the fire.
30 min ES_F - Red box is the area which prices could come volatile if 1420 fails


Sunday, September 9, 2012

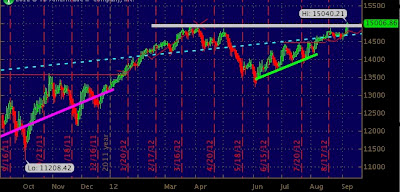
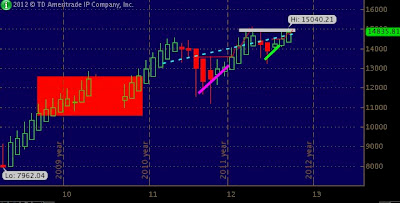
Wilshire 5000 reached the 15,000 mark - the highest level in 5 years

Our surmations from a little over a month ago were on the mark... Not many participants pay attention to the smaller caps names and or the Wilshire BUT considering the strength in both the Wilshire 5000 and the Russell 2000 the last week you cannot argue this rally had little participation. Monday will be a test to see where a new foundation could be build over resistance of 14,950 in W5000 and 835-40 in the RUT

Weekly W5000FLT 
Monthly W5000 

Thursday, September 6, 2012

Let's Ban Corporate Profits -

The video speaks for itself

A look at the Nasdaq $NDX following its highest close since December 2000

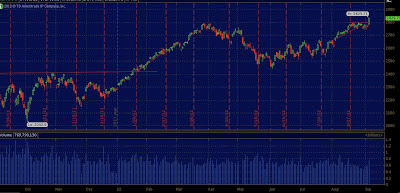
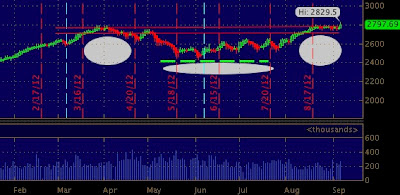
Who saw that coming?? we did. The breaks to the upside of 2800 and subsequent trade into 2829.50 in the futures secured a possible new range for the index.
Weekly NDX
Daily NQ inverse H&S 

One month ago we spoke about the Wilshire 5000

Today we are nearing our 15,000 target from a posted on 8/6 titled "Wilshire 5000 x 3 = 15,000"

.. what happens next.... well we must wait until the 15000 line is crossed.. Currently the W5000 is up 284 points or 1.94 percent at 13966.

30 min W5000
15 min W5000 
Daily W5000

$XHB homebuilders chart update

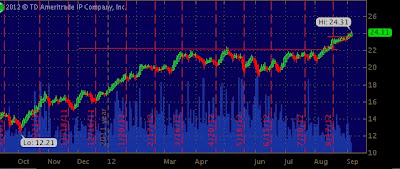
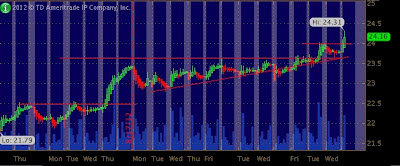
The previous post by us titled - The XHB Homebuilders ETF Did Something Today - highlighted the break over 22.. now we are up into a break out over 24.22.
Daily XHB 
30 min XHB

Wednesday, September 5, 2012

Daily Look at the $NQ_F Chart - $6E_F Weekly Chart

6 months of consolidation under the 2800 level has build a moderately strong foundation down into the 2450 - 2500 area. What is next? perhaps a move like we saw from 12/19/2011 - 3/26/2012.
Daily NQ_F 

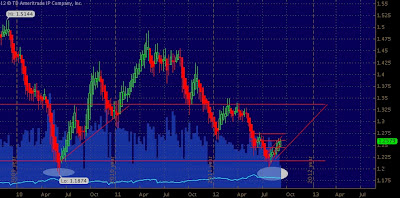
Weekly 6E_F 

Tuesday, September 4, 2012

The Russell 2000 $RUT could move to 847.10 in a game of catch up

1 hour 10 year future
A game of catch up to the large cap indexes which have already made new 2012 high.. The RUT is 25 points or so under the 847.92 2012 high..

 ..That being said...in reference to relative strength in the RUT today..... (IWM = ETF, RUT = Cash, TF = Future)

Did profits from the last two week straight up run in bond prices go to work in the RUT today?  Perhaps....

the general theory is speculative profits usually are used speculate first in smaller cap speculative companies... OR a massive short position was covered in the RUT today.. either case tomorrow will be interesting in regards to where the RUT will open up and or end up ... 820 now support 825 resistance.
Daily RUT
Weekly RUT


Newer Posts Older Posts Home