Thursday, April 30, 2009

Chrysler goes down... takes the market with it...

TOday was one of those days, you know where the futures are up wildly into the open gapping the market. MOst days like today are ripe for a trade called "fade the Gap".. ever gap is closed, especially when a major event happens like today causing a sell off of 150+ points pushing all the way to red close. Lets take a look at a few charts to see if we can formulate the trading direction for next week. I must admit i was caught off guard by the rally we had mid week, maybe i am just a contrarian.

Wednesday, April 29, 2009

Tomorrow brings the "unsure" trade, the riskiest of all...

The trades which come from markets like tomorrow's are ones which are the most risky. Primarily because of mixed sentiment, both bulls and bears are huffing and puffing. Unsure trades make for jumpy trading, over trading and most of all double down. One's best bet is to guage opening sentiment is too watch the trend develop after the first 10 minutes of trading. Every stock, especially options trade wildly at the open, eventually settling into the true market, it is easy to get wacked by a bid being walked down after a day where shorts are squeezed because overnight sentiment changed.
The GDP number which is expected to show a shrinkage of around 5%. SOme people think this is not going to tank the markets because of an article in which Rep. Barney Frank stated "We're hoping there won't be any government funds in banks a year from now," Link here: http://bit.ly/HhlAe Another factor which will weigh on sentiment is the annual meeting over at Bank of America... I think we might be seeing a call for Kenny boys head. Lets hope for the worst, HA. no but i am not a perma bear but if we do rally on some fluff news this week the harder we will fall.

Monday, April 27, 2009

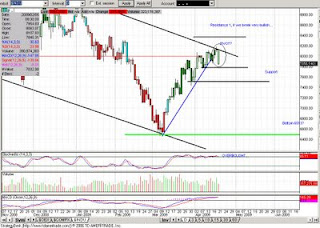
Futures Down 100+. updated DJI daily chart

LOoks to me like the market's are still waiting for something to trigger a mass sentiment change. THere has been lots of indecision exhibited in the past week. I'm looking for a pullback below the first support around 7800 this week. Not sure what day, today's trading will tell the story. We will probably get a nice gapper at the open followed by a bounce then close @ lows. Of course all this is hinged on the days news and how CNBC and the media spin the story. Maybe the quants will take over and not let retail and greed chasers keep buying up the unhealthy market.

Tuesday, April 21, 2009

UUP & SPX daily/weeky charts


Ultra Short S&P500 SDS chart annotation


If you look closely at January 6th and April 17th you will notice SDS pivots at this level. The way i pivoted on April 17th foretells changing sentiment market wide, considering the S&P500 encompasses the largest swath of stocks. ALSO the lower indicators are indicating oversold signals, in order for it to correct the oscillators it needs to jump around 15 bucks either over a few weeks or one large spike. Also the VIX has kept moving upwards, pulling itself back above its lower support of 40.


Volatility Index chart update. ORIGINAL posted on Twitpic

The original annotations of this chart were from sunday april 19th, http://adjix.com/quy2. i had highlighted a target area where i felt the vix could realistically spike if we got some strong downward action before the open on tuesday. The lower indicators on the VIX are oversold indicating we could move about the current solid resistance @ 40. The pullback and or pivot i was looking for sunday http://adjix.com/kx5c confirmed today on average volume. Tomorrow will confirm the the trend is indeed back in the downward channel indicated here http://adjix.com/s99r . I am still cautious as to not being adequately hedged here, vix again becoming elevated means wild swings are upon us.

Monday, April 20, 2009

DOW topped bear market rally. Daily candles charts.

DOW pivot highlighted... moving towards 7800 by close.

Sunday, April 19, 2009

Double top on DOW & S&P500

Will this week bring a downward trading direction? I do not know the answer to this but earnings will tell the story.
A few thoughts on lower indicators: When in over extended trading environments such as the one we are in now, one must realize most lower indicators signals should be taken with a grain of salt because of their wound out level behavior. They normally will indicate overbought and oversold conditions, in the above conditions they really mean nothing, so if you are using a rule based trading system which derives buy and sell signals from say, stochastics, you would have missed out on this whole rally because because the indicators have been indicating overbought conditions for 5 weeks. I am willing to bet most people have a sell signal set for anything above 80 or so on the slow stoch, if that is the case you sold a long time ago.

Friday, April 17, 2009

Ashton Kutcher won the Twitter race.. Oprah's "first tweet"

Twitter and Stocktwits are going places, they are growing on their own.... no need to bring the masses into an untested and untried product.. It's growing, come back in a year.
Ooh and Oprah is tweeting her first tweet live on her show today... I already blocked @Oprah... -
check this link for more Oprah "first tweet" updates. http://adjix.com/2var

Thursday, April 16, 2009

Are shows like Fast Money on CNBC giving away the traders secrets?

I was kicking around thoughts in my mind today stumbling across the topic of "models". Models as in trading models, which ones work and which ones have been "outsmarted" over time. Everyone who has been in trading understands over time trading "systems" eventually terminate, because the market begins to react differently given the same set variables. The reason i mention Fast Money, is there has never been a show on television which deals directly with advanced market strategies, such as options. The protection and leverage options has afforded people is something i feel is learned and earned, because they are usually coupled with a winning market strategy. NOw that every Joe bob who watches Fast Money thinks they can play the stock/options active trader game are either loosing big, or in theory causing strategies such as, edge/hedge, technicals such as support and resistance etc. to be become less and less profitable. This could be a ridiculous hypothesis, but i find these thoughts more often then not jumping into my mind when i see certain technical conditions go unnoticed. Primarily regarding our situation right now, a market which seems overbought but the oscillators simply mean nothing because they are so wound up. You got Fast Money contradicting itself every other day, and the talking heads on CNBC cheerleading higher higher as of late, lower and lower in the ladder part of the year. It seems everyone is trying is slanging technical trading strategies on infomercials and on the Internet. Bottom line is, when you have person's all over the media telling you how easy it is to make money by following "OUR" strategy, its time to look for a new strategy. There is always two sides to a trade, if everyone is playing one side, everyone will lose/ BUT the free market works problems out, social Darwinism Time will tell.

Google earnings commentary: http://adjix.com/47t5
Chicago Cub's schedule: http://adjix.com/2uw6

Wednesday, April 15, 2009

S&P 500 DAILY AND WEEKLY ANNOTATIONS.

Tuesday, April 14, 2009

Retail Numbers Down. Possible Pivot today. Follow me on Twitter!

The weaker than expected Retail numbers, seen here http://adjix.com/hu54 sunk the media's sentiment of the market today. The media has been cheerleading all the way up, im ready for them to eat their words.
Referring to the chart i annotated yesterday , http://adjix.com/j75t you can see the candle we formed looks a bit bullish, with the real body being very small and near the top of the wick. This is because, in layman's terms, a tug of war between bulls and bears, with the bulls clamoring to push the market above resistance. The bears the exact inverse. It looks like today we observed a pivot back into the downward trending channel. Today's movement coupled with tomorrows close will confirm the new trend. TAKE all this into account when playing Google's earnings AH on Thursday. GOogle could smash and take the market with it, but it might be enough to move us above the averages again.

Monday, April 13, 2009

Short time? WE could be @ a pivot point market wide. ps Goldman crushed..

The chart on the left show a few intermediate term break outs and break downs. Looking at charts in this frame, i believe helps those untrained better identify different trading patterns and eventual resulting termination by way of break out. THat being said, where do you think we are going to trade from today? are we going to mind the upper resistance top of channel and pivot? or shall we break out per earnings blow out this week? Either way its your gonna win, just straddle the market here. I personally want to pivot, maybe we break out a bit then pull back into the channel?

Earnings this week GS and GOOG.. Recovery?

This past week has been quite the euphoric ride straight up on seemingly nothing but hot air spouted out of the mouths of the CNBC chatter heads. You gotta give it to them, CNBC that is, they have orchestrated a pretty good pump, their sentiment has done a complete 180 in the past month. It went from "How low can we go?" to "How high can we go?" "Is it too late to get in?" blah blah blah.. Anyway, all the BS does not even matter, what does matter is earnings. There are some big names reporting this week, the primary focus is Goldman Sachs and Google. Goldman is rumored http://adjix.com/kr3y, to smash earnings, SECOND highest profit in the company's history. My opinion on trading this rumor is to play sentiment, if it looks like its gonna smash buy some calls, maybe 150 Mays. Denninger seems to be on the right track about Goldman and its hedging of the CDS's over at AIG.

Over on the Google side of things, Erik over at http://adjix.com/m2sb has a hunch Google might be going to pull a fast one and blow out earnings. This is all based on his theory about Google walking back their earnings estimates in the weeks prior to reporting, causing the PPS of google to price in the new lowered earnings numbers, then bam they report and the stock pops!

Saturday, April 11, 2009

DJI annotations. Break out? Program trading and Chinese drywall !

Based on the chart to the left one can hypothesize where we might go in any number of ways. For me, i am at a loss here, i see we have broken through out 100 day SMA, the purple line, but we did so on lighter than normal volume, this could indicate program buying. or it could indicate a possible quick squeeze for a sharp pullback on Monday to correct the technicals.

I am still bearish but Monday is going to be a key day for swing traders and the like, stay focused and remove emotion from this trade.

 I know a lot of people are full of excitement, the market is rising, it will keep going! If the market pivots on some shitty news, flip the trade around. Since we are not fortune tellers we cannot see into the future, lets just shoot for a 51% success rate at calling the direction.

Article on Program trading over @ Goldman Sachs http://tinyurl.com/cmgofx
Article on Chinese drywall used in the housing boom causing problems http://bit.ly/4ebOCH

Thursday, April 9, 2009

Wells Fargo? profit? 3 billion? WHAT? i knew they were strong but..


I guess you could have fooled me, Wells Fargo posting a huge profit helped by the acquisition of Wachovia Bank. Wasn't the reason WB offered itself up was because of its toxic assets, so what has WFC done with them? A question i do not have the answer too. I look at pops like this as a great short in the AM. if you see a stock pop to a 20% gap at the open, short it. This is a very good market gap fade lesson, now i doubt WFC will close the gap today, but trust me it will eventually. On the macro side of things, the market is still overbought and i am still bearish.
Link to WFC article
Fading the gap article:
My Twitter:
http:///sellputs

Wednesday, April 8, 2009

StockTwits and Twitter aiding in the "TWade"..

Yes that is Twade, my term for a trade spotted from StockTwits. For anyone out there who does trades actively, you should take a look at twitter. I look at twitter as one all encompassing squawk box... a lot of what is "tweeted" is actionable...

http://tinyurl.com/dauqbf USA Today article on Twitters explosive growth!
http://mashable.com/2008/09/16/twitter-traffic-growth/ Interesting article
http://venturebeat.com/2008/12/17/stocktwits-nails-stockpicking-on-twitter-raises-round/

StockTwits is an interesting social program which utilizes the real time nature of twitter to make relevant tweets on current stock happenings. Day trader's and the like seem to be the ones who first picked up on this, now the masses are jumping in for the ride.

Others seem to be followings.. http://venturebeat.com/2008/12/17/stocktwits-nails-stockpicking-on-twitter-raises-round/

Jim Cramer = moron. Market Volume Declining. Anticipation?

Today was quite a choppy day, boring movements on low volume. These are they days when you sit around and play bouncy ball around the office waiting for trades! Technically speaking on most index charts we have broken, or are just about to break trend.(bearish) The violent rally has been trending nicely up until yesterday and today when the volume dried up. Could the almost 50% drop in overall market volume be foretelling a possibly reversal? One thing i do know and you can see for yourself in the chart too the left is the oscillators needs to unwind on daily candles. For this to happen we must drop to the 74.86 Fibonacci retrace level (7543 on the dow). If we hold this level of support we might bounce, but from the looks of things the chicken is not out of the frying pan. AIG, GM and even C still have a lot of things they need to sort out, maybe we have not bottomed? whatever i don't care if we bottom, it all makes for great trading in a high volatility environment.

Tuesday, April 7, 2009

The correction! even with all the CNBC CHeerleading.


If you look back to my posts on Friday of this past week you will notice how the chart for the Dow was looking for a break out. The break out has failed and we are now in a period of low volume price decay. If you look at the volume indicators you notice volume is all but half it was during the peak of last month. IF one were to surmise a guess as to where we trade from here, my guess is down. If you take a look at the blue uptrend line which the price has stayed above so far you will notice the candle for today is holding strong. Tomorrow will be the knee knocker too see if we fall. i think we fall all week. Im currently long FAS puts. i do see the VIX rising a bit The VIX is holding support at 40.

Monday, April 6, 2009

TEchnical Analysis brush up! Break out charts

GReat resource for brushing up on your break out pattern identification.

http://www.chartpatterns.com/cp_prs_shameless_promotion.htm


make money from break outs...

Technical reversal market wide... *technical*


I know most people who participate in these markets do not understand, nor do they believe in charting. I for one believe this entire market collapse and subsequent rally over the past month has been purely technical. Primarily i base this hypothesis on the fact that markets simply do not drop 30% straight down without a technical bounce to unwind the oscillators and get things somewhat trending again. A good example of this is a Daily FAZ chart where the lower Stoch is completely oversold.. If you look at the volume spike on the April 2, that was not enough to unwind the stoch at these level, but it does tell of major interest in FAZ.. Major interest in FAZ and or SKF is bearish financials obviously, but it shows most traders are looking for a pivot play. This chart should help everyone visualize the oscillations of levered ETFS.

Sunday, April 5, 2009

Next week sell off?

It looks like i am going to update this blog a bit more now that i have a bit more time on my hands... anyway if you are on twitter... follow me on there.. /sellputs..

Anyway i think the hanging man we have here on the SP500 and the DOW will break down and we will see a broader sell off through the week. I am not sure what to make of the UP tick rule.. it is possible it has been priced into the market already... i do not think we will rally much higher on the news.. i am looking to sell the news ..

Friday, April 3, 2009

Our current situation in regards to the dow...

IF we break out too the upside we are in for continuation rally... if we fail we fall and hit supports 1 and 2 over the next month or so.. IMO

Newer Posts Older Posts Home