|
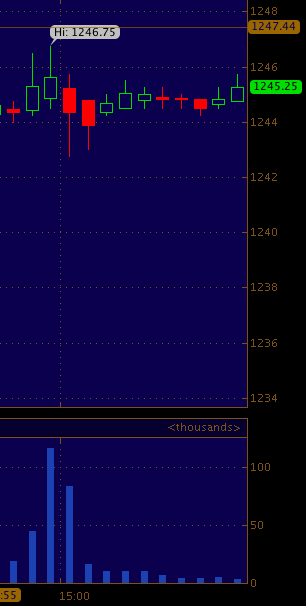
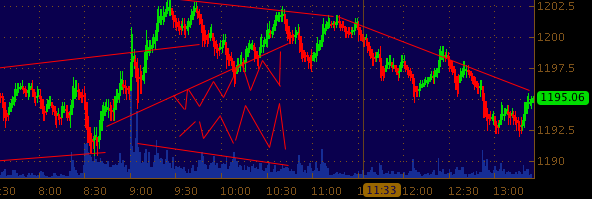
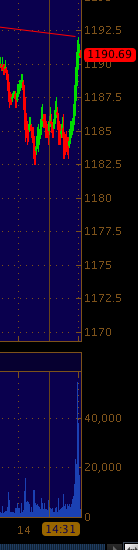
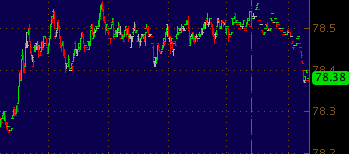
| 1 min ES |
|
| 1 min ES.. notice the massive spike.. puts in perspective ratio |

|
|
| 1 min ES |
|
|
| 1 min ES.. notice the massive spike.. puts in perspective ratio |
|
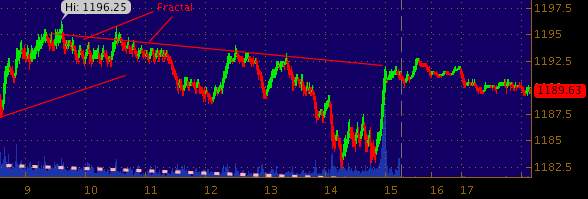
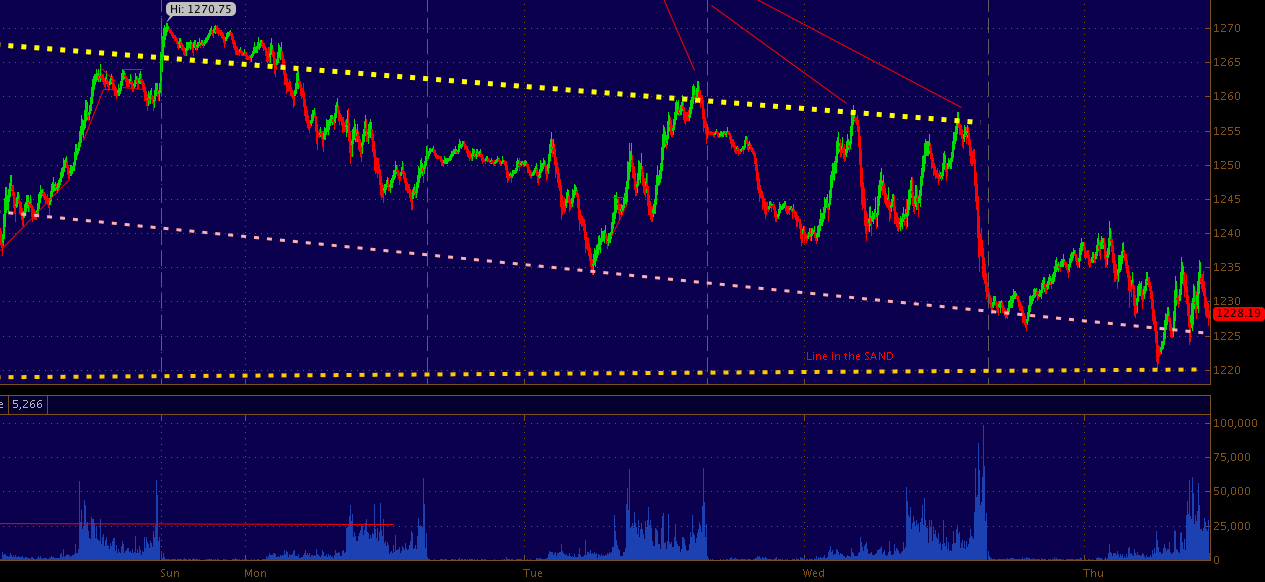
| 5 min ES |

|
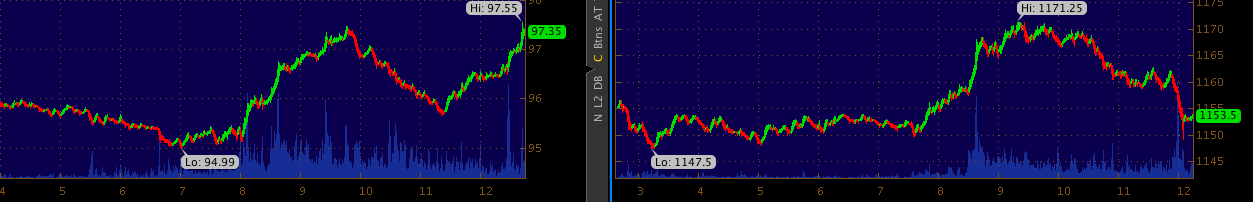
| 1 min |
|
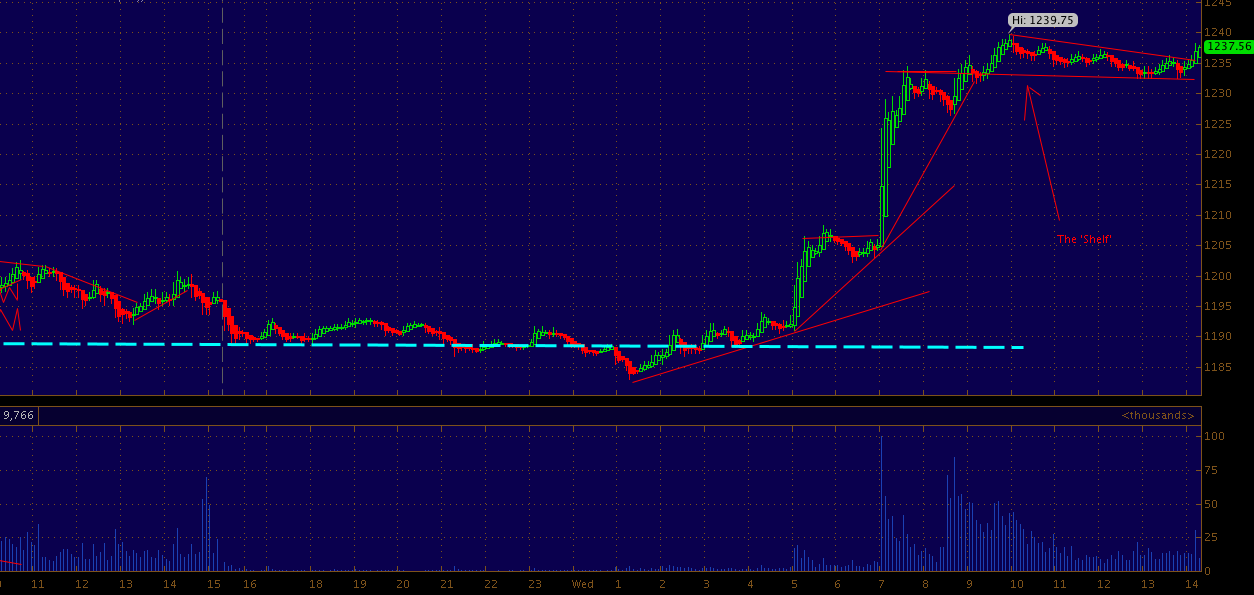
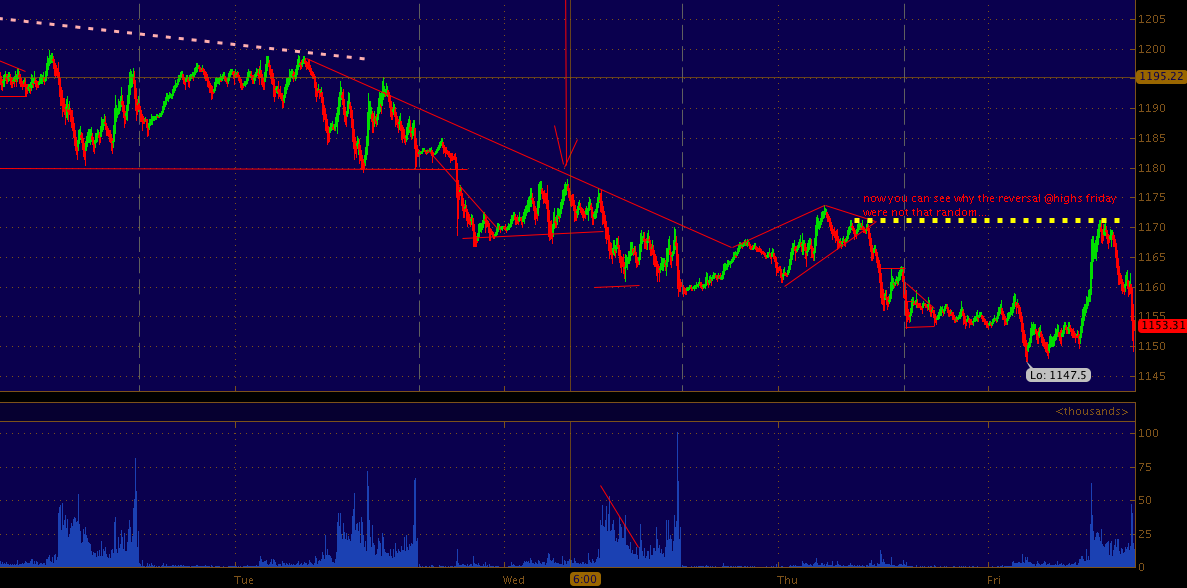
| 5 min ES.. |

|
| BAC |
|
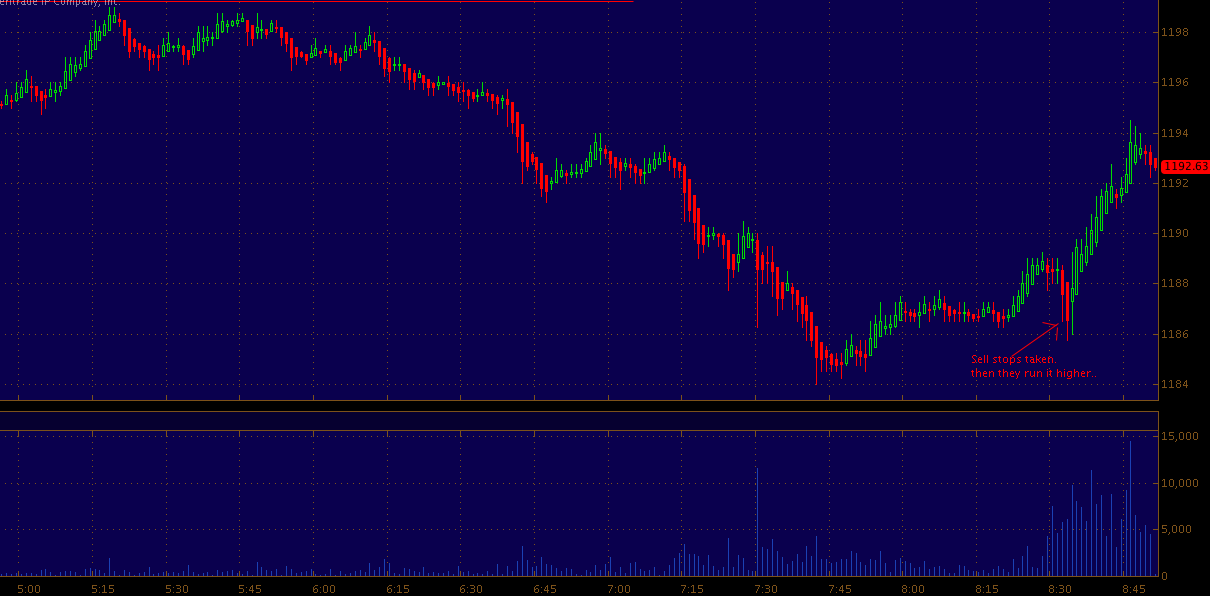
| 1 min ES |

|
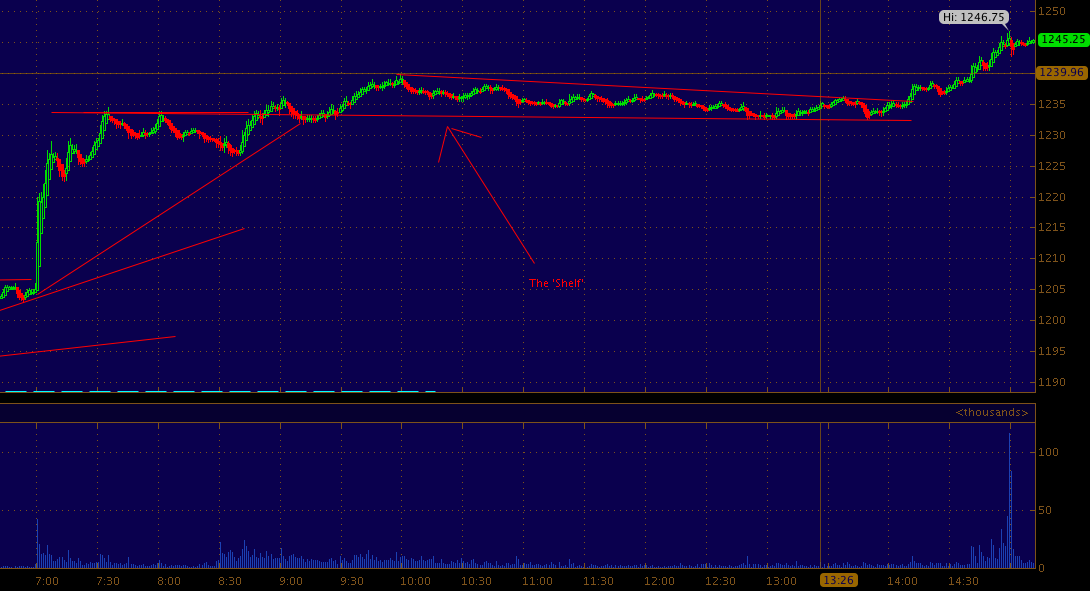
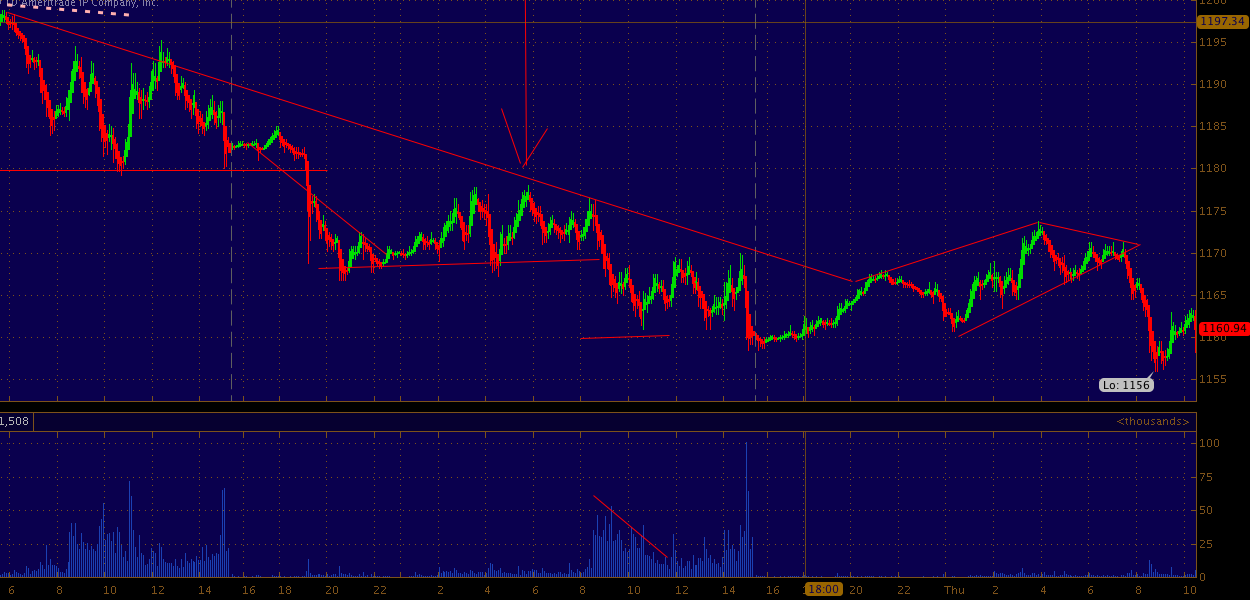
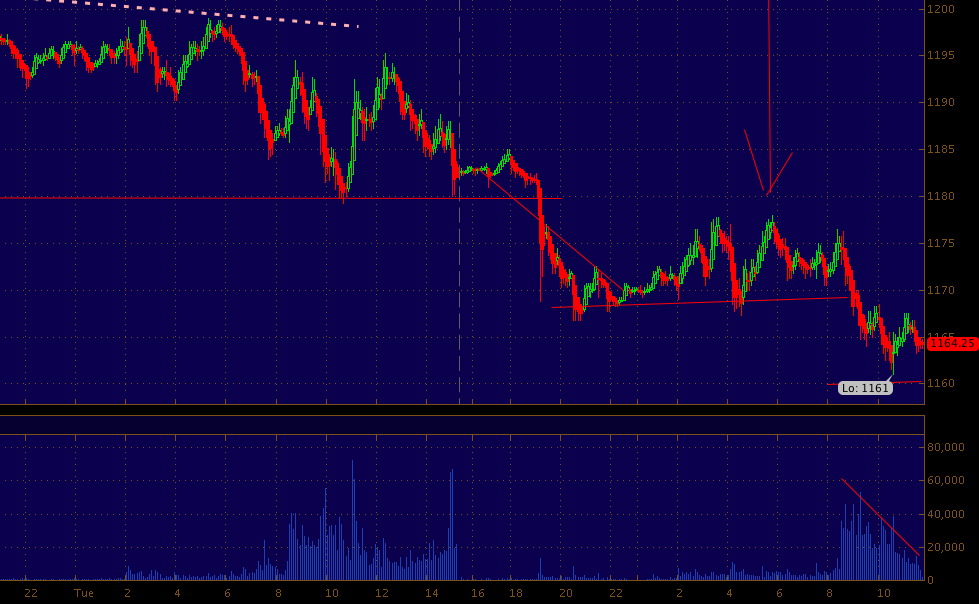
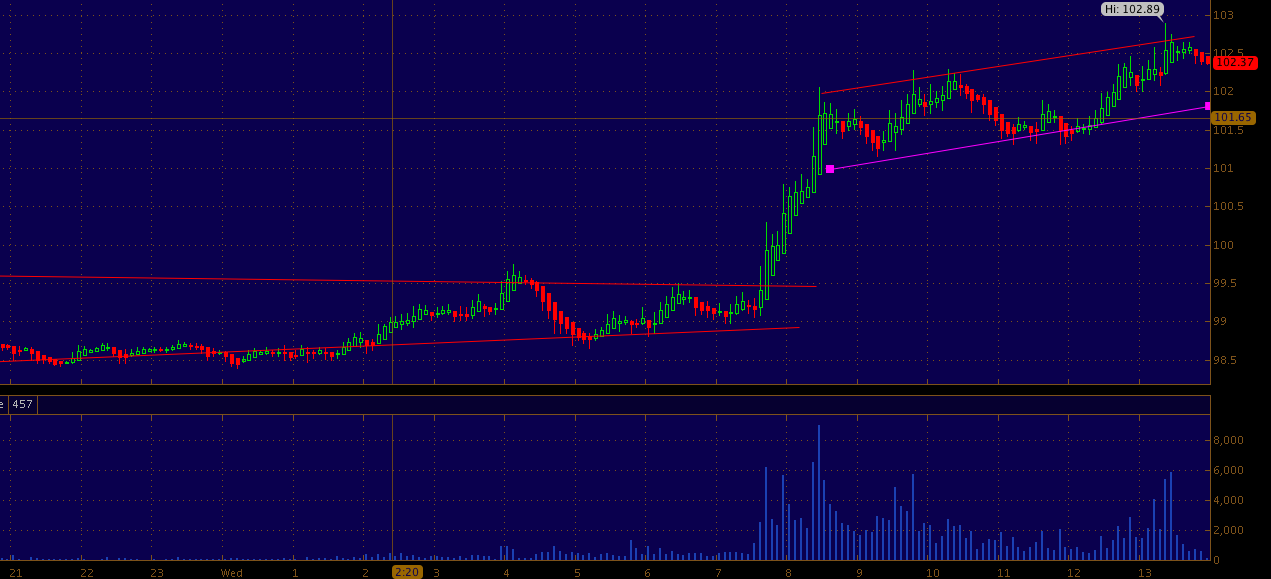
| 1 min ES.. volume declining .. price rising.. chomp chomp |

|
| 5 min |

|
| 1 min ES |

|
| 1 min ES |
|
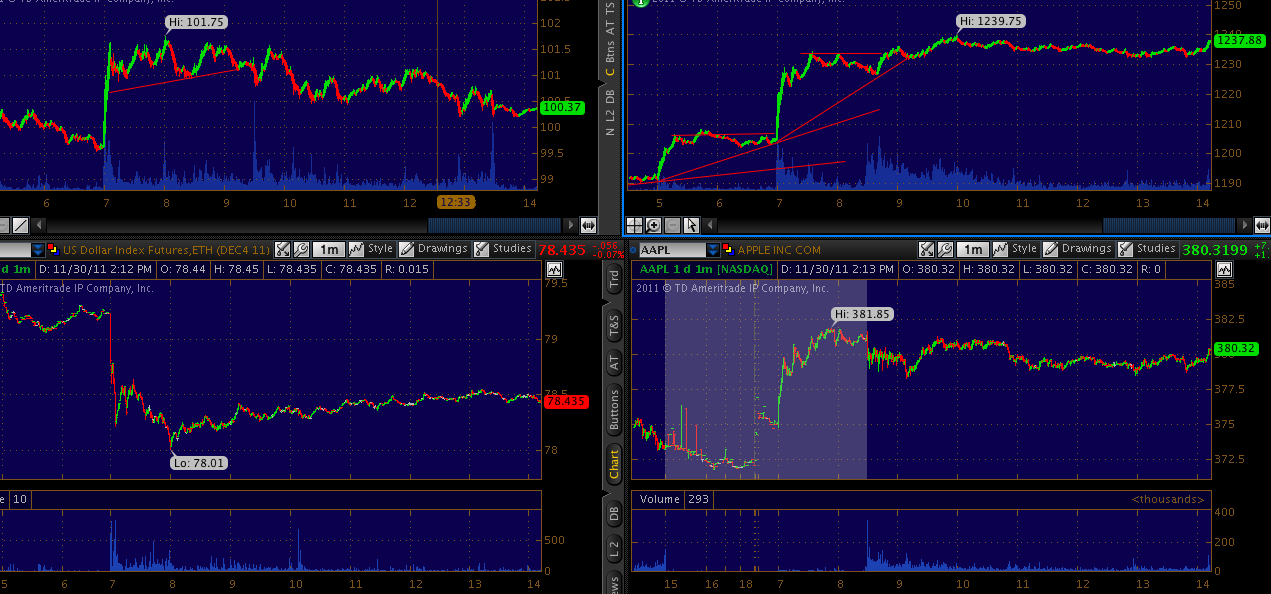
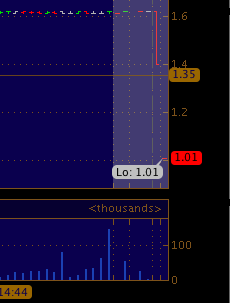
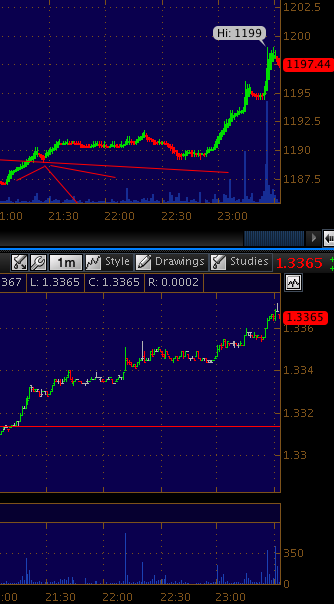
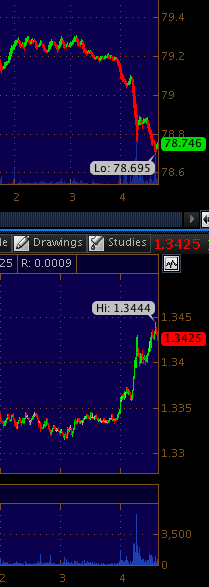
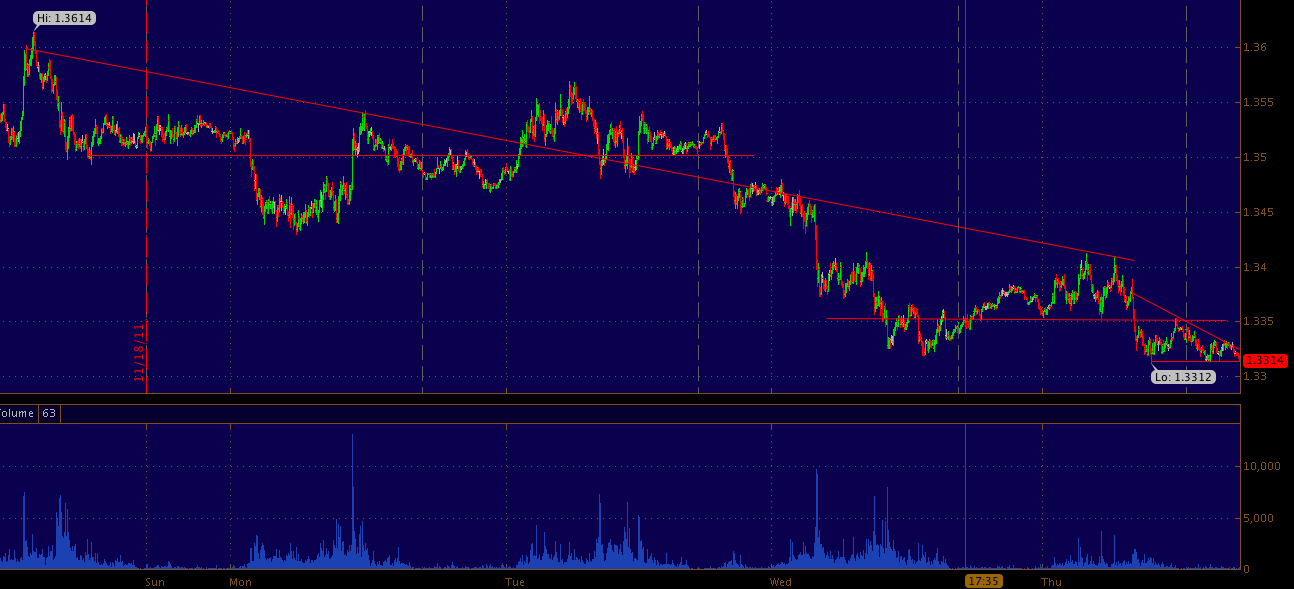
| DX vs 6E |

|
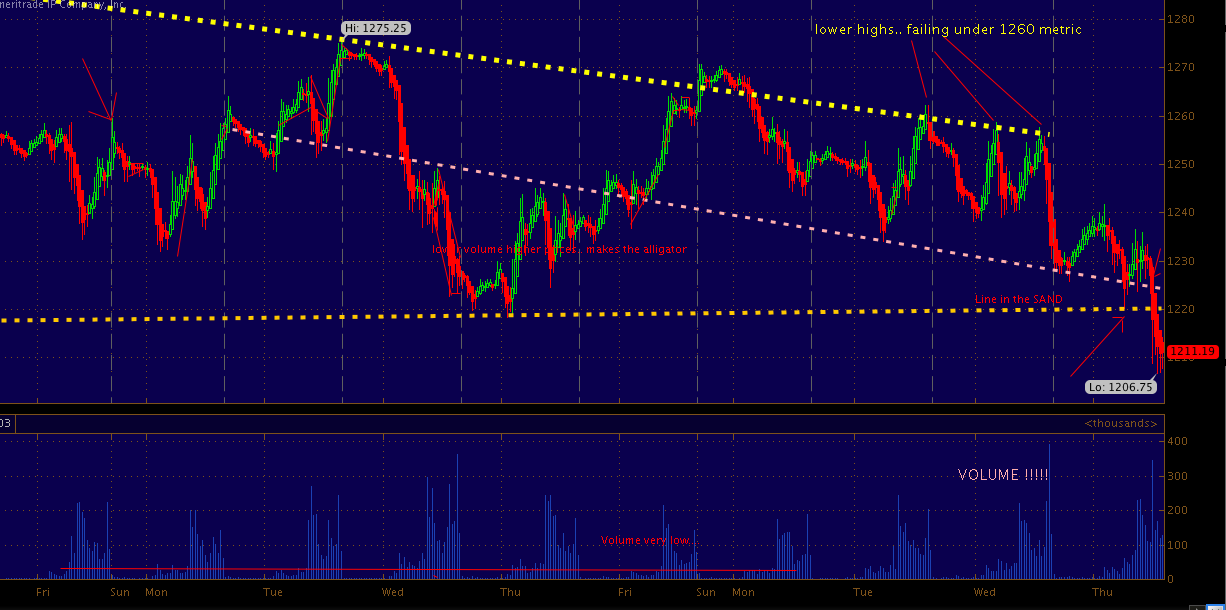
| 51 min ES_F |

|
| 15 min ES_F |
|
| 1 min ES |

|
| 1 min ES |

|
| 1 min ES |

|
| 5 min |
|
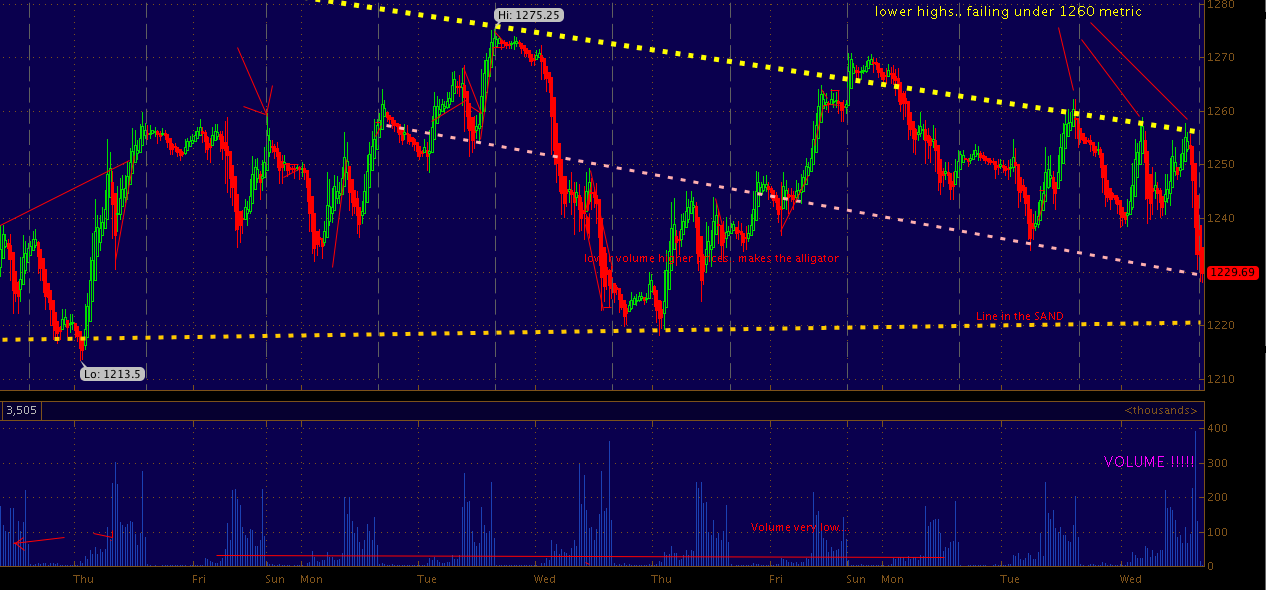
| 5 min ES |
|
| 1 min CL/ES * worth noting ---- Funny how crude moved in the exact opposite direction of the index's into the 30 min of trading... |
|
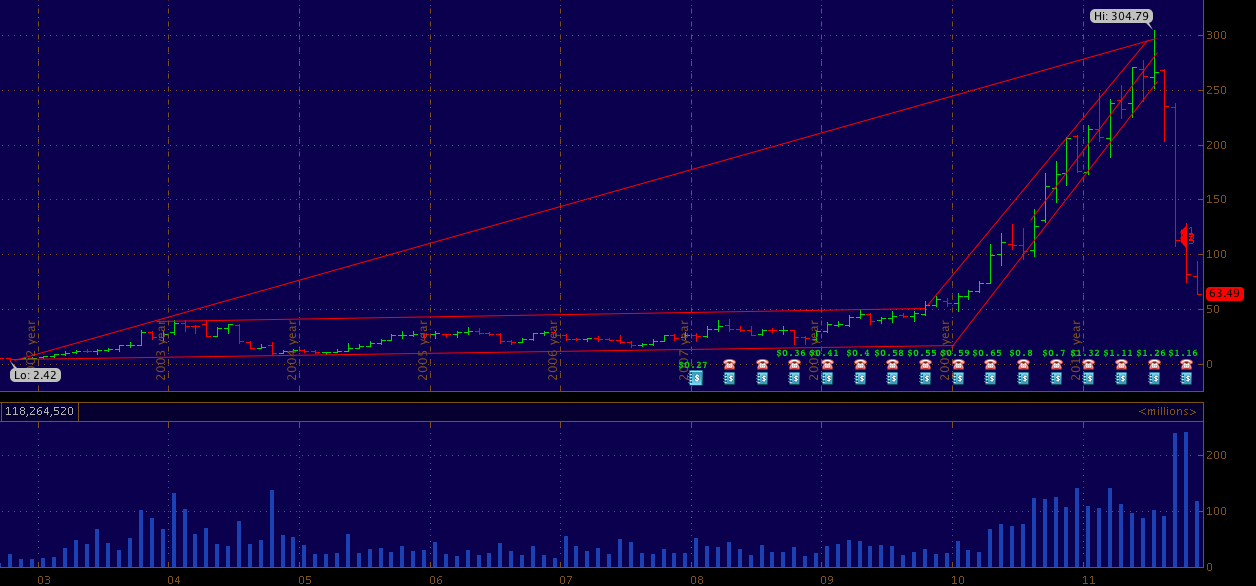
| Monthly NFLX |
|
| 5 min |
|
| 5 min ES |
|
| 5 min ES |

|
| 5 min ES_F |
|
| 5 min ES |

|
| 15 min ES |

|
| 5 min ES |
|
| 5 min ES |

|
| 1 hour ES |
|
| 1 min ES |
|
| ES 5 min |
|
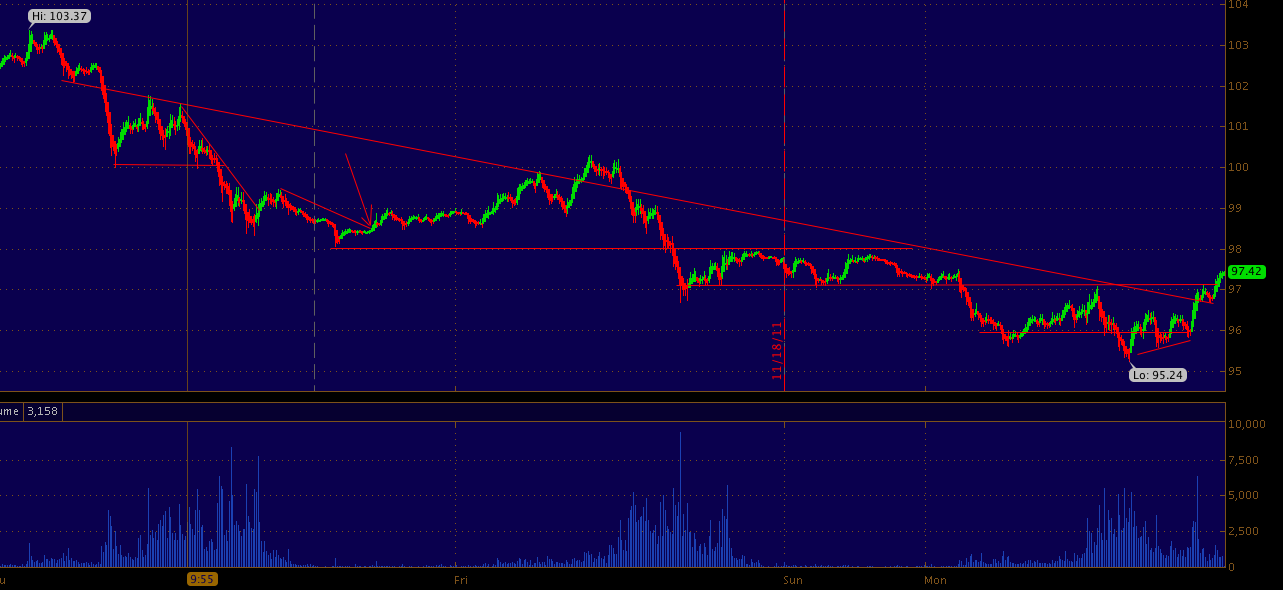
| 5 min cl ... |

|
| 5 min ES |

|
| 1 min CL |
|
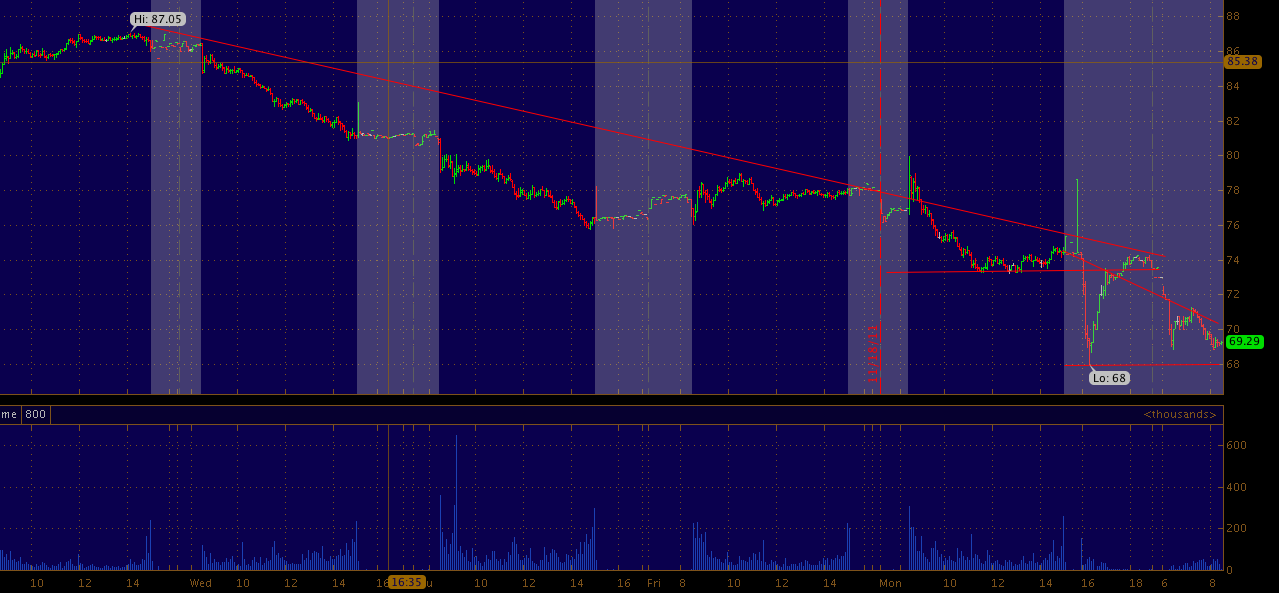
| DX 5 1 min |
|
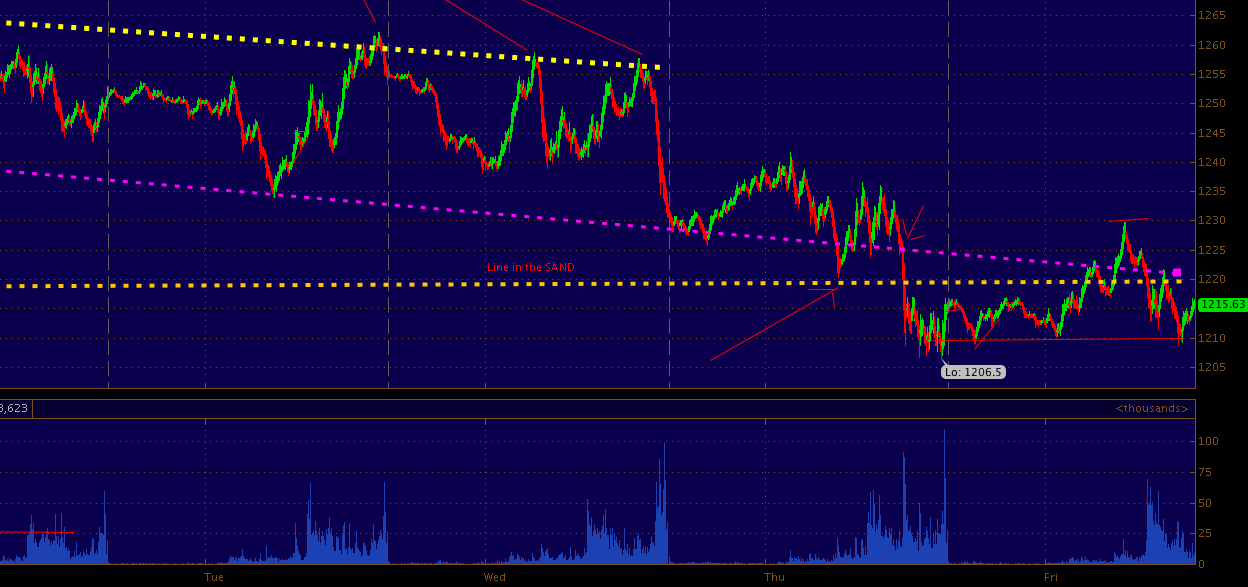
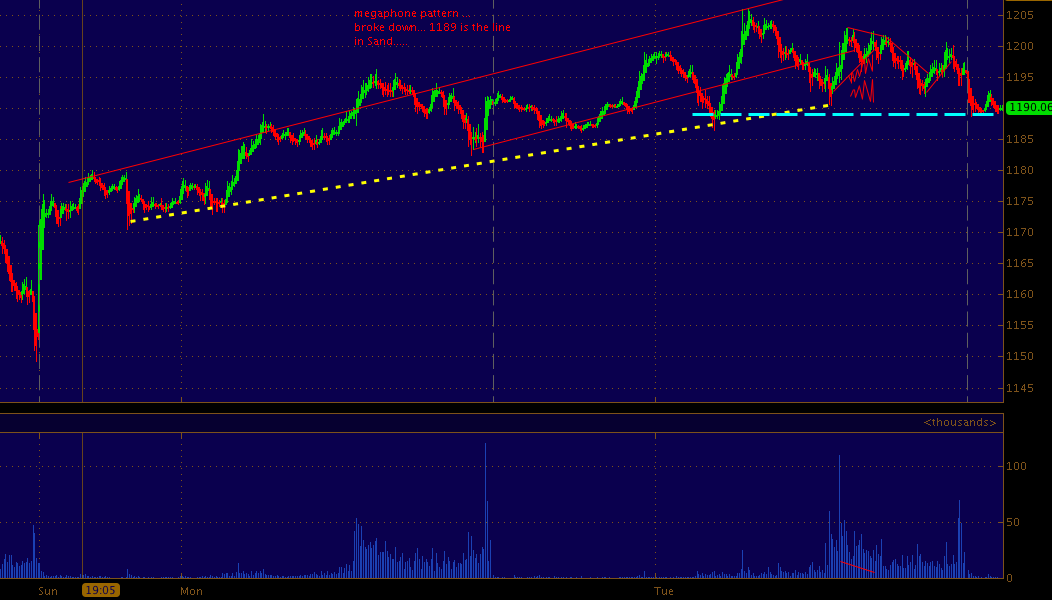
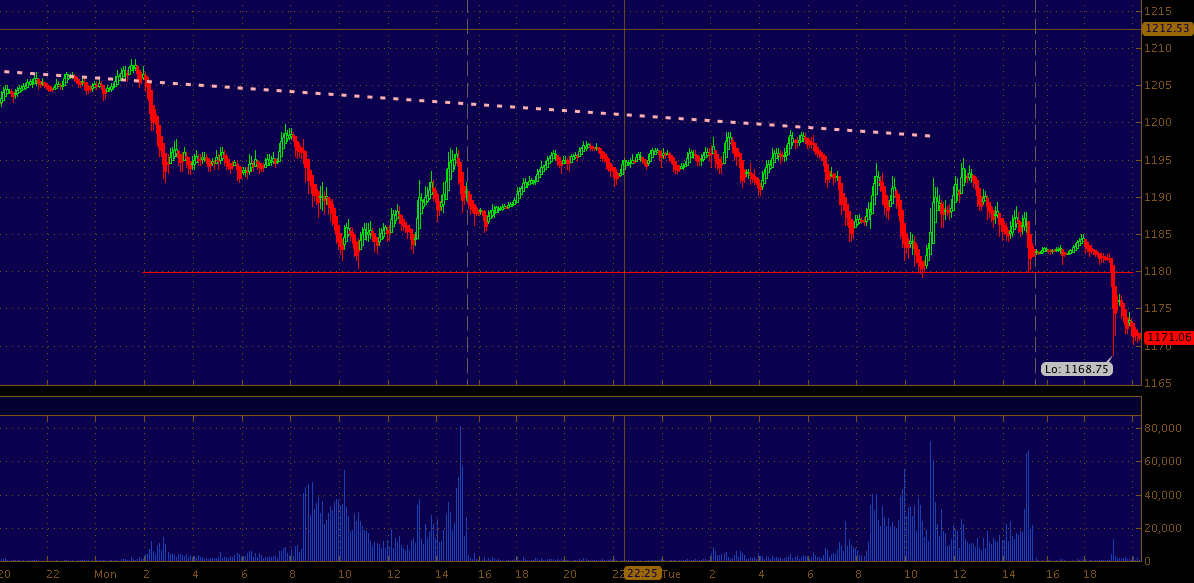
| 30 min ES.. |

|
| 5 min ES |
|
| 5 min ES |

|
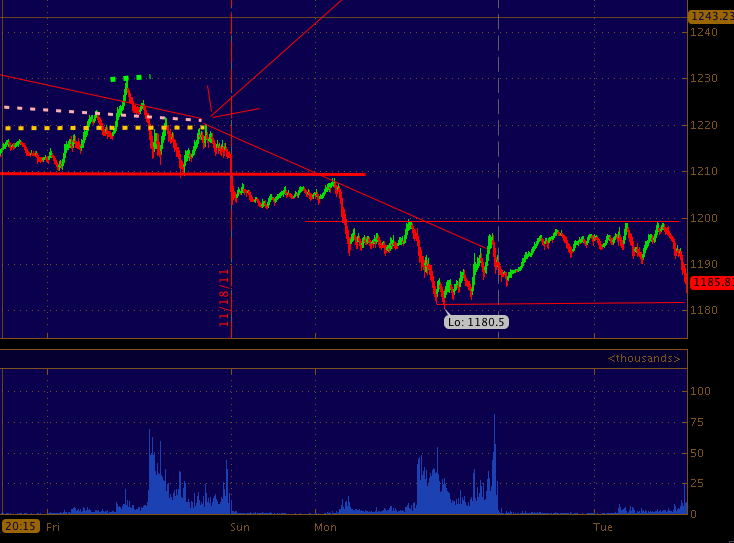
| 30 min ES_F |
|
| 15 min ES_F |
|
| 1 min CL |
|
| 5 min ES |