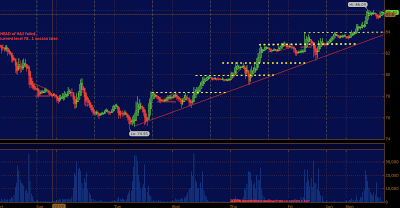
Now that you have studied the chart above lets back track to last Monday when the ES traded below 1190. I posted an article on monday of last week highlighting the fact the S&P's could rip higher based on the last 3 months of trade. And that precisely happend.
What happend below 1190? we traded to below 1175 chopped around as the bearish news flow was flipped by the media (even though the news flow stayed bearish) to positive. This flip in sentiment
coincided with a massive short squeeze of epic proportions, just like magic. get them all short and run it up, get them all long and sell it.
ANyway we are at a precipice now that the S&Ps are back to the 1200 level four sessions after a low for the year was put in(120 handles). The billion dollar question is, will we continue this 10% rally up another 10% in the next 4 sessions or will the media magically flip into a bearish tone scaring traders into profit taking? We will find out tonight, dont be surprised if we do pivot down.
And how about crude oil and gold? gold is up to 1677 after having a strong day today. Crude oil is back to the 86 level trading in lockstep with equities. can we say synthetic tax? If you want your dumb ass DJI to stay up near all time highs you are going to get 90+ crude jammed up your ass. Perfect scenario for a recovery just in time for christmas.
 |
| 30 min CL . perfect short squeeze up from the year low.. 10 points. like magic. stair step. |


