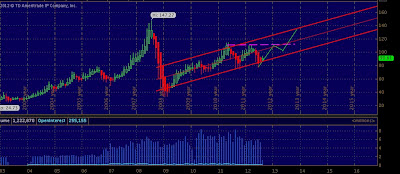
The 80 level in CL was quickly regained after the sharp selling which took place beginning in early May took the price from 104 a bbl to below 78 a bbl. Now that the chart i annotated about a month ago has some data filled in lets take a look and see where the price could possibly be heading.
In my estimation we could see 95-100 before a sharp pullback due to profit taking within the commercial bank books. Once profit taken ensues the price could see another push back into the 100 level if equities and risk stays in favor as the fall/winter rolls in.
Of course all of my thoughts are hinged on the price maintaining the current channel that has been formed since the early 2009 bottom in equities and commodity prices. Stop by the Trade For Prof.it forum for real time futures and equity market discussion by real traders.
 |
| monthly CL |
 |
| weekly CL |


