
two charts.. you can take from them what you want... my view is the yellow line.. clearly 1420 is a big upside level of attraction.. as is 1300, especially if the dotted purple line fails before 1420 is taken out..
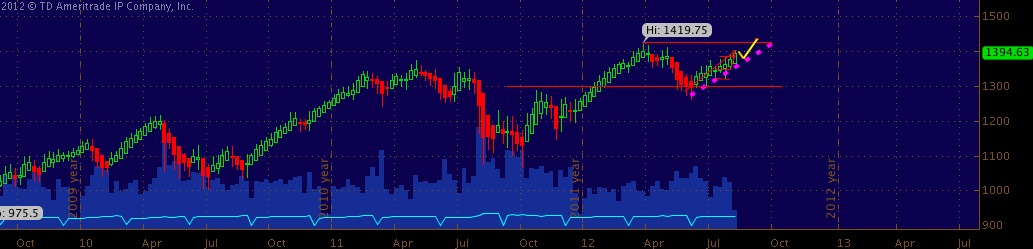 |
| weekly |
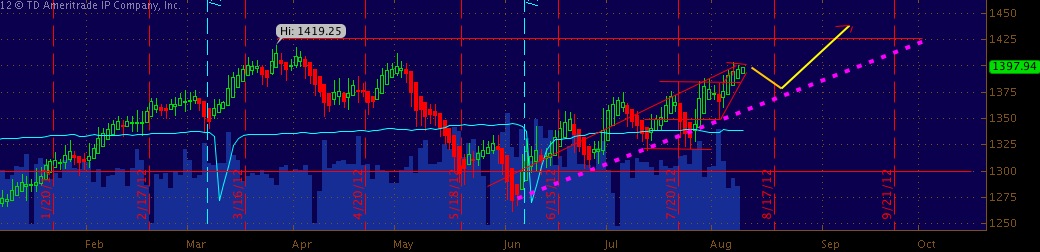 |
| daily |
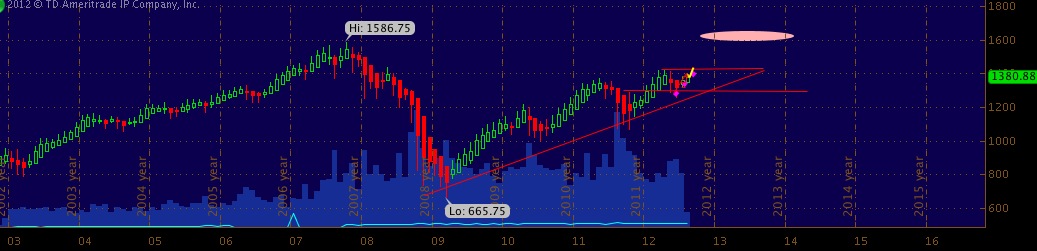 |
| monthly |


