 |
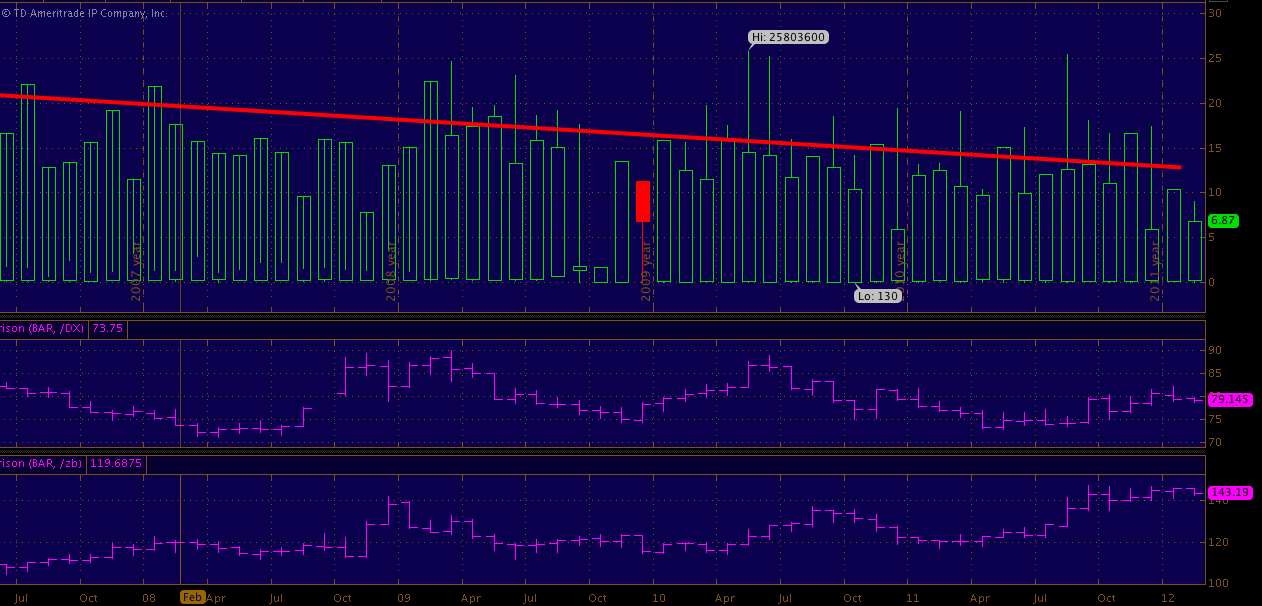
| monthly NYSE volume with the 30 year and dollar plotted in the lower. |
As the 30 year near 140 you can see above how equity volumes react.. this is all normal right.. risk comes out of equities and goes into a safer asset, dollars. How long can the trend last? is there a huge move coming or will treasuries and dollar give up their bids soon as europe resolves?