

 |
| 3.2 year RUT SPX comparison |
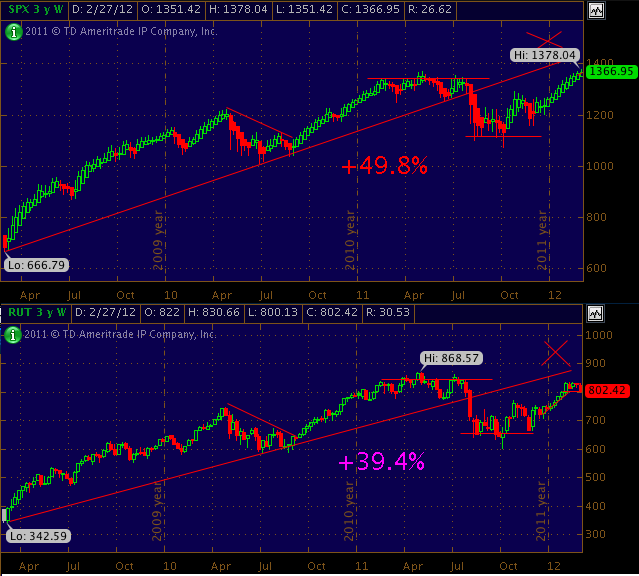
Quite possible, but you must realize the RUT since the March 2009 bottom, has under performed the SPX by a metric of 10%.
You can see from the chart below the, the recent divergence started Tuesday morning with the RUT breaking down and also Wednesday when it failed to make a new high with the SPX.
Looking back from march 09 to today, the RUT has consistently underperformed the SPX by 10% . From march 09 to the April 2011 highs the RUT is 39.4% higher while the ES 48%.
What does this mean? means there are times where the RUT over reacts a bit while the greater index remain more stable.
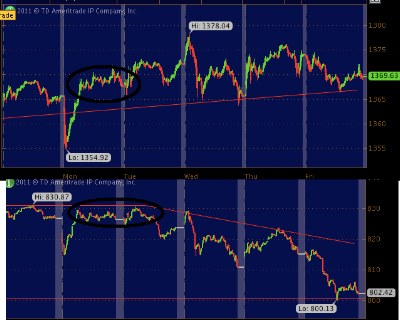
This weeks SPX on top RUT on bottom. both 5 min


