Thursday, January 31, 2013

Trade for Profit Market Summary for Thursday January 31, 2013

5  min ES.. note 1490 purple line
The theme of today was consolidation over the 1490 level as the low this morning was 1491.25 following a disappointing weekly jobless claims which rose by 38,000.  Due to the fact 1491.25 held further weight is now placed over 1490 which if it fails it means a trade into 1485, under 85 = 73.50.
Subscribe to the TFP Insider here


On the upside in ES we are looking at 1498.25 as immediate resistance with the 1500 level being max upside tonight.

Over 1500 means 1502.60, but tentatively i would wait for either a break up OVER 1500 to scalp upside or if you want downside, wait for break down under 1491.25 to take a short.

Wednesday, January 30, 2013

TFP Market Summary for Wednesday January 30, 2013

ES_F 15 min (NOTE the PINK held @ 1495
Equity markets relented today after a *seemingly out of nowhere GDP miss* spooked investors into taking profits. The S&P 500 futures traded as high as 1506 before the GDP miss send a long tail down below 1500 into 1498.25.

The S&P meandered over the 1500 level up until the FOMC decision hit the tape @ 2:15 pm ET which left rates unchanged.

TFP letter for Wednesday January 30, 2013 | $GDP $RIMM

1 min ES_F showing GDP PRINT
Overnight Musings

S&P 500 futures traded into the 1506 metric overnight Euro FX futures or 6E as the contract is known broke out over the 1.35 level to trade as high as 1.3567.

Currently the S&P 500 future is lower by 1.50 points to 1503.75 which puts support at 1502, below = 1500 test, below 1500 its 1498 so on and so forth. Top end will get wound out over 1510 in both SPX and ES_F. 1498.25 traded on the POOR GDP print as we were writing this.  under 98 means 95 

Tuesday, January 29, 2013

TFP market summary for Tuesday January 29, 2013 | $HES $PFE


SPX weekly
The S&P 500 has started off its 9th week out of the last 10 going back to the week of 11/26 on a green foot.

The S&P 500 futures closed over the 1500 market today at 1505.50 thus both the ES_F and SPX have closed over 1500 with YM and NQ dragging behind.

The Nasdaq 100 NDX added .04% to close @ 2743.58, the Russell 2000 RUT added 0.07% to close @ 907.31 after trading into a new 2013 high of 907.91. The S&P 500 SPX added 0.51% to close @ 1507.84 after trading into a new 2013 high of 1509.35.

Monday, January 28, 2013

Rouge Trader Movie

Sign up for the  to get access to live chat and privare twitter feed..

Apple Inc. Vs. Research In Motion YTD stock performance | $AAPL $RIMM |

YTD AAPL vs. RIMM 

Sunday, January 27, 2013

First clips of Ashton Kutcher as Steve Jobs [Video]

The first clip of Ashton Kutcher playing Steve Jobs has been released. The movie is called `jOBS' and is scheduled for an April 2013 North American release.


Source: Bloomberg

Thursday, January 24, 2013

TFP Letter Market Summary For January 24, 2013 |

5 min SPX 
Equity indexes traded in a wide range today with the S&P 500 SPX closing 1 penny in the green @ 1494.82 despite shares of $AAPL falling 60 points or 12% into 450. The NDX took it on the chin but in my personal opinion it held it well as shares of AMZN GOOG and NFLX rallied.

Carl Icahn does not "like" or "respect" fellow fund manager Bill Ackman $HLF

Carl Icahn tells Bloomberg's Trish Regan he doesn’t "like" or "respect" fellow fund manager Bill Ackman, criticizing the way Ackman publicized a $1 billion bet that shares of Herbalife Ltd. would decline. Icahn says:
“You don’t go out and get a room full of people to badmouth the company…If you want to be in that business, why don’t you join the SEC?”

Transcript and video below..

Goldman COO Gary Cohn Bullish on global equities | $SPY $EDC $EEM

Goldman Sachs President and COO Gary Cohn told Bloomberg TV's Erik Schatzker at the World Economic Forum today that he's "fairly bullish" on global stock markets. Cohn said: 
"The cause of interest rates going up, which is greater economic activity and greater growth, will be very positive for our business."
On whether Goldman has brought costs down far enough, Cohn said: 
"I never know the answer to that. We are in a unique industry. I have said this before and I will say it again: I have never had a day at Goldman Sachs where I've felt like the firm was perfectly sized. At the bottom of the market you feel like you are way too big. At the top, you're way too small. In the middle, you are trying to gauge not only what is happening today, but what will happen tomorrow. Based on our view of where we are today, we feel like we're in pretty good position. But I could change my opinion on that tomorrow."
Transcript & video below

Roubini from Davos: "problems are global, but policies are national

Nouriel Roubini of Roubini Global Economics and Ian Bremmer of Eurasia Group appeared on "Bloomberg Surveillance" today from the World Economic Forum in Davos.  

Roubini said that "problems are global, but policies are national" and that "coordinating among different countries is going to become increasingly difficult. Political tensions, economic and financial tensions, like currency wars, can lead eventually to protectionism."


SOURCE: Bloomberg Television : transcript below

Wednesday, January 23, 2013

TFP Market summary for January 23, 2013

$AAPL 1 min showing AH low 
Equity indexes logged another day of gains after the house approved a debt ceiling extension into May. With the debt vote unknown out of the picture for a few months, earnings from IBM MCD and GOOG helped to lift the SPX higher for a 3rd day this week.

The S&P 500 SPX added 2.25 points or 0.15% to close at 1494.81 after making a high of 1496.13.

TFP morning letter for January 23, 2013

5 min ES
Sign up for the TFP letter  delivered to subscribers 7:30 am ET.

Overnight Musings 

Today's focus will be on the debt ceiling vote which is expected to pass and will raise the debt ceiling (kick the can) enough to fund the government for three months. I believe the the markets have priced this raise in which is why the S&P has maintained its current levels.

Morgan Stanley CEO James Gorman: money is still cheap

Morgan Stanley CEO James Gorman spoke with Bloomberg Television's Erik Schatzker from the World Economic Forum in Davos, Switzerland today. On cutting employees' compensation, Gorman said that "everyone is comfortable with somebody getting well rewarded for doing a good job, but the problem in our industry and others in the past has been getting rewarded for not doing a good job." video below..

Tuesday, January 22, 2013

S&P futures trade 1,490 on $IBM & GOOG results

15 min ES_F 
Today's trend was pretty smooth if you ask me, no funny business beyond the standard opening hour drip into 1475 which was quickly purchased and converted into 1480 support.  (red line on chart with red arrows under is 1475)

Once the 1480's which were the middle of the 1484.50 / 1475 channel, converted to support the S&PS did not look back until 1485's were bought into the last hour as anticipation of IBM and GOOG raised the tape.

To the downside 1485-1480 now gathered weight below = 75's like a stair step only backwards.. over 1500 for $SPX = 1,520.26 target of ES_F 1,511.50

Market wrap for January 22, 2013

Daily RUT inverse H&S 
Sign up for the TFP Insider private twitter feed.

Trends like we saw today do not come every day as the fluidity of today's tape is one that has alluded us for sometime. If you identified today's pattern of higher highs and higher lows you were able to catch 10 points of upside in the ES_F.

The real story was in the Russell 2000 RUT as it traded into a new all time high of 899.24 closing up 0.72% +6.4396. The chart in the upper right shows the inverse H&S breaking out over 835 which we highlighted here in plenty of time for anyone to catch the swing. 
AAPL 5 min "smile" 

The Nasdaq 100 NDX 2.95 points or 0.11% to close @ 2746.19 as weakness in shares of GOOG and AAPL weighed on the tape.

Apple managed to move higher into the close trading 506.63 currently 509.10 AH as google reported and surged to 739.  Also Research in Motion added 13%.

Weekly SPX inverse H&S
The S&P 500 SPX added 6.58 points 0.44% to close @ 1492.56 just 77.445 points away from the 1,500 metric.

The S&P was aided by a strong performance of the financials today which saw the XLF make a 3 year high of 17.36 to close @ 17.31 up 0.93 points. WFC also up their annual dividend by 14%. 

SPY: Support = 149 Resistance = 149.50, 149.72
QQQ: Support = 67.40 Resistance = 67.60, 68 
IWM: Support = 89.35 Resistance = 89.50, 89.60

TFP Morning letter Jan 22, 2013

Trade for Profit Morning Letter

Sign up for the TFP insider & private twitter here.  The letter goes out to subscribers at 7:30 am CT.

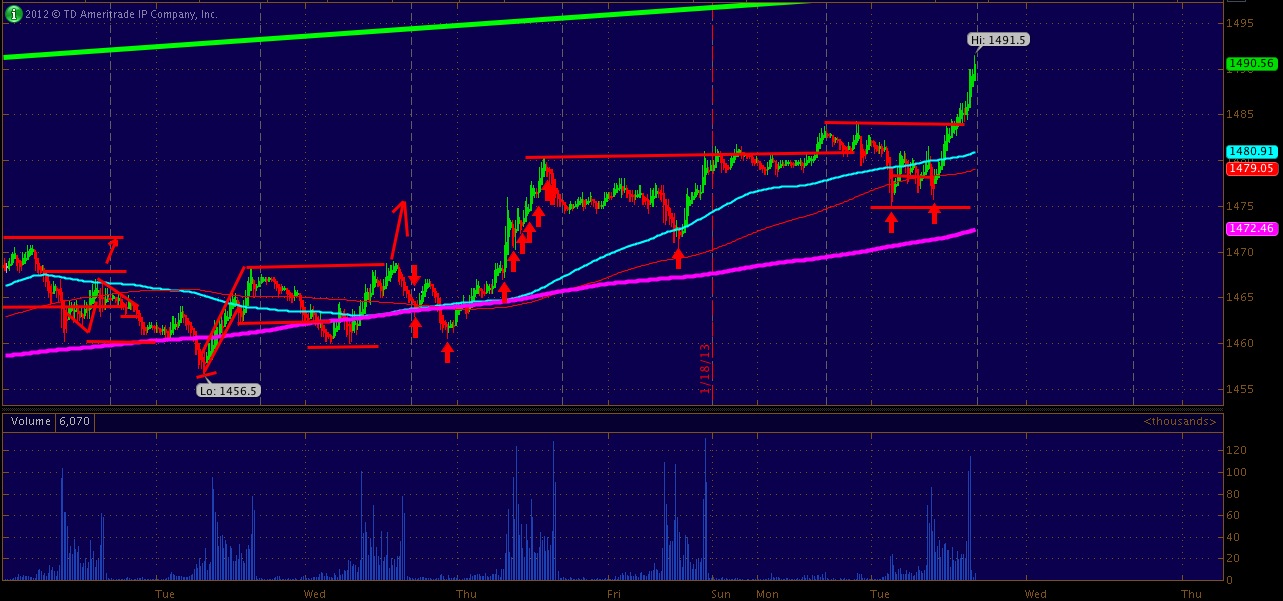
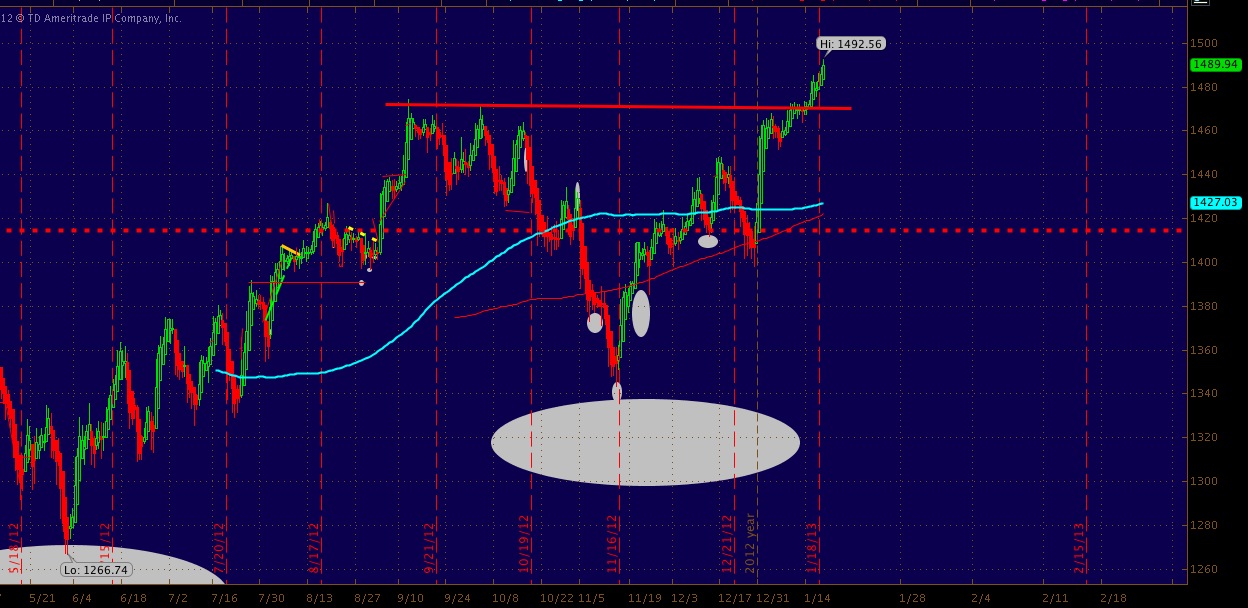
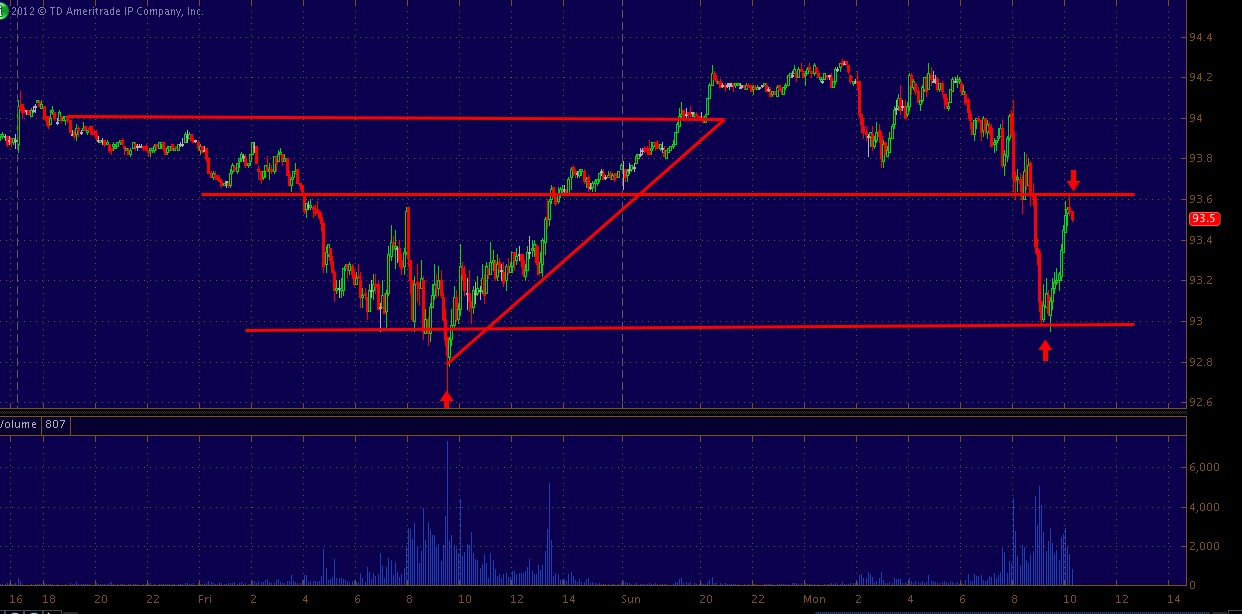
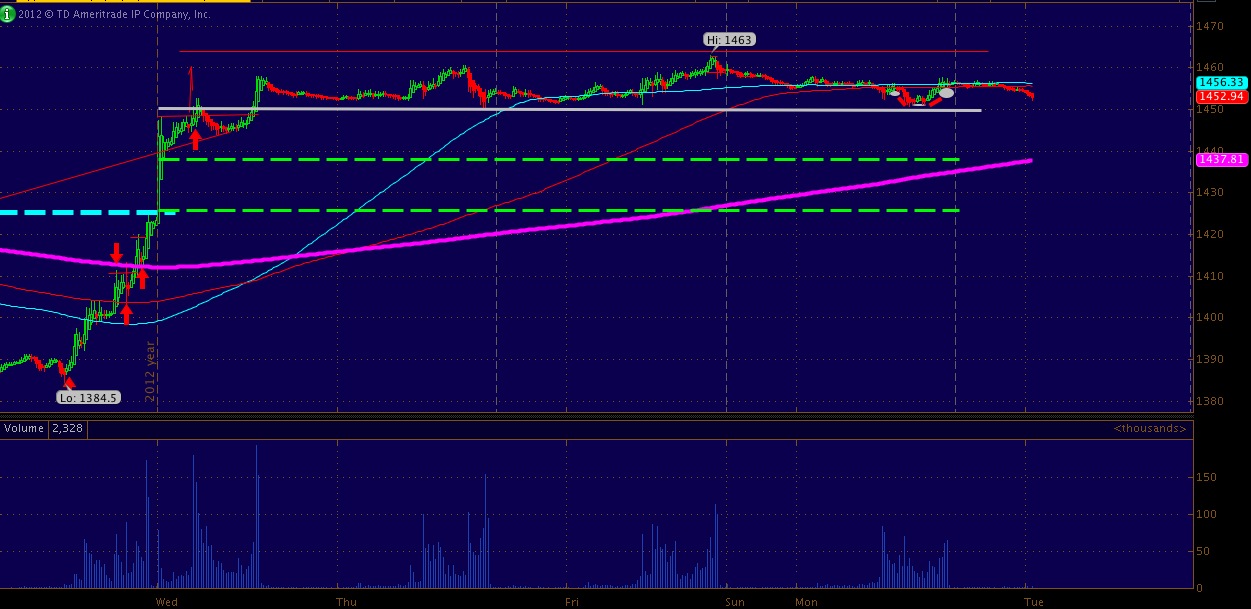
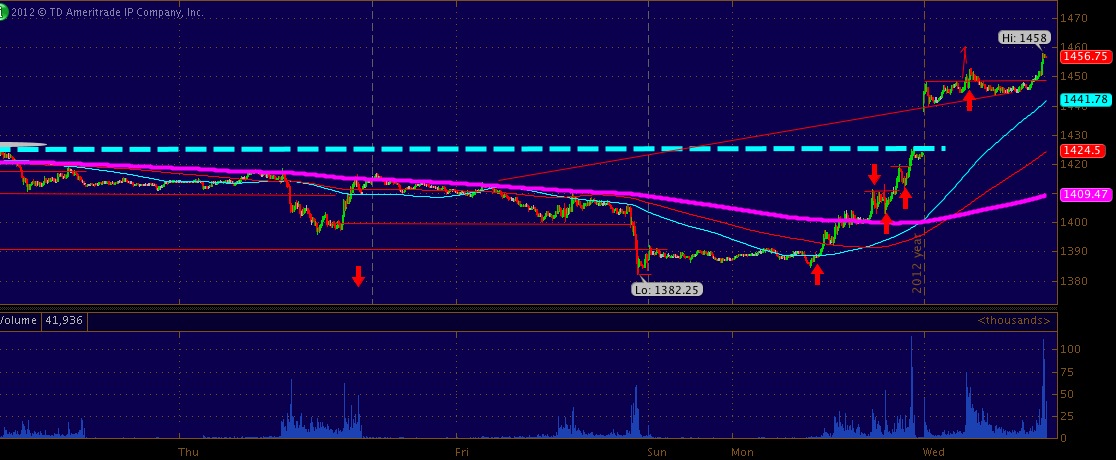
Good morning and welcome to the TFP letter. Today's tape looks moderately soft at this point with the S&P 500 futures well off their highs of 1484.25 at 1476.50 currently.

Much of the tape needs to consolidate and digest the past week's up move so do not be alarmed if we break 1470, but i would not be surprised if we take out 1485 before the day is over.

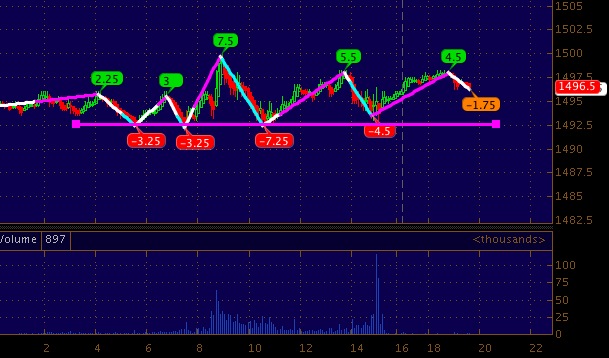
We are currently waiting for one of two things to happen before a trade is triggered in the spooz which is a break over 1484.25 converting into 1490 or a failure of 1475.50 converting into a test of 1470's from last week. In between one could play 1480 as support if the price moves back before the cash open.

Much of the overnight weakness in aud/jpy eur/jpy can be attributed to Japan's Prime Ministor Shinzo Abe agreeing to purchase $145billion in securities a month but is putting the program on hold until January of 2014.  Abe is trying his best to end stagflation-deflation in Japan with a target of 2% inflation “at the earliest possible time” with an open-ended buying program. Because of this the Yen is up to 88.50 per dollar as of this writing.
Stocks

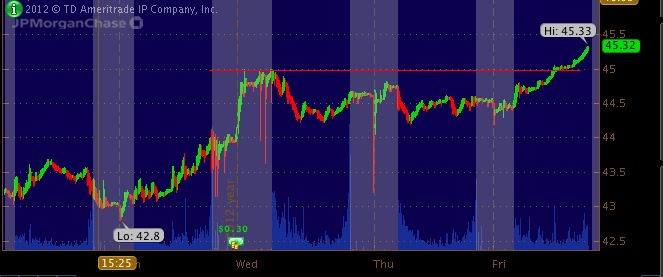
Shares of DuPont are higher to 48.21 in pre-market trading after the company reported better than expected EPS of 11 cents per-share up from the 7c a share expected. Shares of Johnson & Johnson are lower to 72.35 after trading as high as 73.74 in early trading.

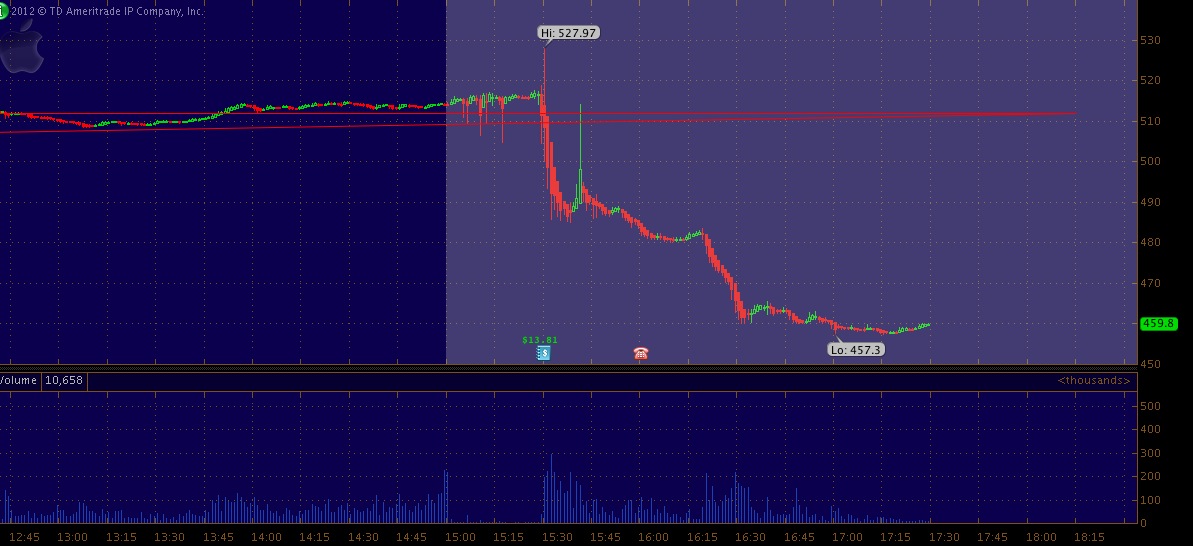
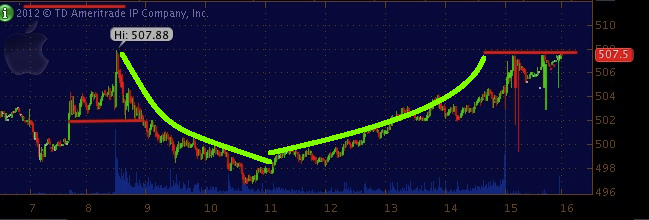
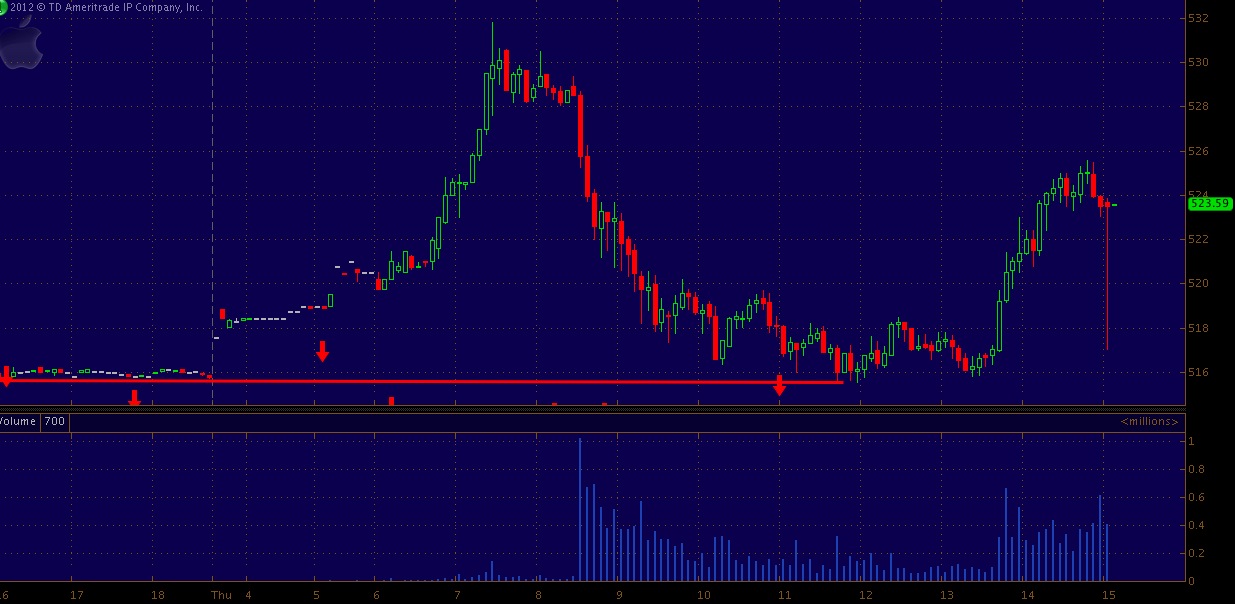
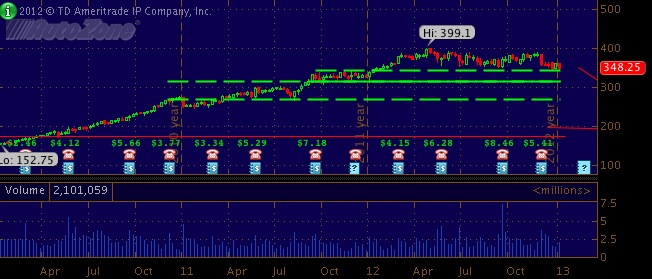
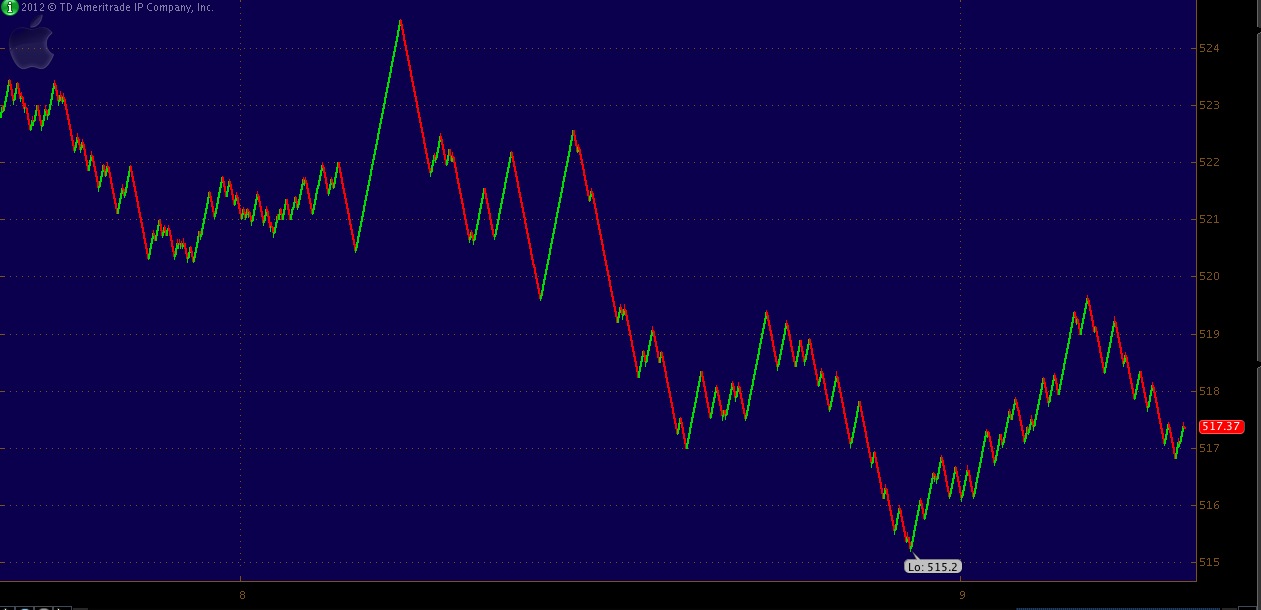
Apple shares are back at the 500 level on the nose as its shares fell from 503.75 in early trading. Due to the magical close @ 500 on Friday's January opex you can expect a break of the 500 level to cause selling into 498, over 504 means 510 based on prior trends.

Bonds are lower with the 30 year down 0.28 percent or 12 ticks to 145'15, below 145 means further downside into 144'17 over 145'25 could pressure sellers to cover into 146's.

Commodities

Crud futures are lower by 0.05% to 95.99 after trading as high as 96.20 before falling to 95.50 support before bouncing back over 96. Under 95.80 = 95.60 over 96.20 = 96.50. Gold futures are in the green up 6 points to 1693.30 or 0.38 precent after falling to 1689.30 which puts the 1700 resistance level in play, over this level surely will trigger buy stops. Gold under 1688 could push lower into 80. Remember always have a plan

Links

Sign up for the Trade for Profit Insider 
Investors most bullish in 3.5 years according to a Davos Poll 
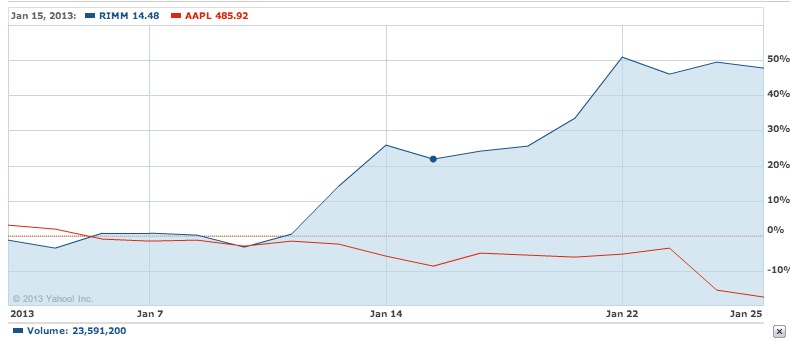
Apple may face first profit drop in 10 years
Atari files for bankruptcy in USA


Sunday, January 20, 2013

Tweet archives are now available from | flash crash

Interesting tid bit of information for everyone....

You can download your within the settings menu on your twitter homepage.

Speaking of i went back to find my tweets from May 6, 2010, the flash crash.  Below.

Tuesday, January 15, 2013

The Russell 2000 & Dow Jones Transports made all time high today... Leading by example? | $IWM $RUT $DJT |

weekly Russell 2000 
The all time high the Russell 2000 placed today was 884.84..... We spoke about the Russell 2000 on the 2nd of the year indicating a inverse H&S pattern.
"The real story here is the Russell 2000 small caps as they broke out to multi year highs this morning after the index played possum for months. Chart below"
This inverse H&S has begun to break out to the upside of the right shoulder with 875 being the break out............with perhaps 900 being a reasonable target. A weekly zoom below the fold.

Monday, January 14, 2013

A look at the natural gas future chart | $NG_F $UNG |

NG_F 15 year - note the volume crescendo 
With 2013 firmly in swing and the buzz once again is focusing on natural gas prices as a warmer than 'normal' winter pull on price analysis. 

When looking at the chart zoomed out you can make a lot more of nat gas trends verses zoomed in minute to minute.

The nature of nat gas is a big mover having regular moves of +or-3% day's clobbering many traders who fail to see the macro trend.  With that being said where might NG be going?

Comparing $RIMM to $AAPL on a 1 year frame

Money flowing between this large pair trade..... 
1 year AAPL overlay RIMM

A 5 minute look at Crude oil Futures | $CL_F $USO |

5 min CL
Interesting price action worth highlighting this morning as we had the typical overnight melt up until around midnight where a seller took the price under 94 from 94.25.  The price recovered then failed again as the morning approached.

Once the floor session of CL opened @ 9 am ET the price failed 94 like a knife through butter all the way down to 93. What is interesting about 93 was it was the pivot Friday.

Notice what happend today, 93 traded then a few stops a few pennies below 93 were triggered then a 60c bounce into Friday afternoon right shoulder of the inverse H&S. The arrows show the pivot.

A look @ $AAPL ahead of Monday's open

1 hour AAPL (click for larger)
As you may or may not know some apple news hit the wires over the weekend about the company halving orders of LCD screens from parts suppliers.

Apparently the article is a month old as a Deutsche Bank analyst already noted on January 4th the slashed component order, that puts AAPL's price around 540 when the news became public...

The pre market low for apple is 497 which is slightly above the December 17, 2012 low of 496.69. Would you not think smart money would know something about the above order cut?

 i would think so considering the amount of $ tied up in Apple stock.

Sunday, January 13, 2013

S&P futures quietly bid into Sunday night

5 min E
Good evening... the complex is a bit jumbled this evening with bonds a light shade of green while the dollar is a light shade of red with equity futurs sitting @ 1470.75 +3.50 or 0.25%.

The trade setup i am looking @ is a scalp long over 1472 with offeres up to 1474.  Under 1468 could trigger some stops and short signals into 1466-65.

Wait for either scenario to dictate your trade.. Below are a few different time intervals of ES_F.

Thursday, January 10, 2013

Russell 2000 $IWM prints all time high WICK this morning

monthly IWM 
 Anyone else notice the all time high WICK print of 87.69 in the IWM russell 2000 this morning premarket? i am sure someone did..

IF this print was indeed real.. foreshadowing? and IB raised small cap margins Zerohege is reporting..

The most heinous chart of the week is $AAPL

5 min AAPL. note the close off lows around 515..

Wednesday, January 9, 2013

Interesting $AAPL 5 min chart pattern to ponder

Updated $AAPL 5 min - 
5min AAPL

Tuesday, January 8, 2013

A 1 min look at the $ES_F this Tuesday evening

1 min ES - note 1455 and the low under 1450 ....

Is it time to take Autozone off autopilot under 340? | $AZO

weekly AZO
The retail autopart supplier market has been returning parabolic gains since $AZO took off over 10 years ago in 2000.   Since this date $AZO has went on to trade 399.10 a share before exhibiting some troubling to macro trend price action thus far in 2013.

This morning $MS cut the company's rating to underweight from equal weight.
Morgan Stanley analyst David Gober, who said AutoZone is “likely not a great stock in 2013.” via Bloomberg 

Not so Profit Shares. A look 20 year look at For Profit Education | $COCO $APOL $DV $EDMC

Corinthian Colleges 20 year
'enlarge'
With the for profit education sector buzzing as earnings season kicked off with Apollo Group cutting guidance we felt the need to share a few 20 year charts......

What we found interesting about for profit education company share performance is all shares took off around 1995 and gained 25 to 30x in value before collapsing to their present values.

Both Apollo and Corinthian shares topped out in the late spring of 2004.  Shares of $COCO fell from had a comical 20 year journey from 2.66 a share to 39.19 a share back to 2.66 a share today. The pump then the dump.

A look at the $ES_F overnight price action & the 15 min Chart

15 min ES
Resilience over 1450 further solidified the 1463/1450 channel today as the ES_F further digested the new years run up of nearly 10% in 3 sessions.

The white line @ 1450 is the even horizon into 1443- then next story is 1440 (charts below fold) ...

That being said take a look at the overnight activity down into the 1452.50 level, the head of the inverse H&S from earlier in today's session.

Monday, January 7, 2013

$AAPL shares again under pressure as $AMZN shares make all time highs

This is what $AAPL looks like 1 tick @ a time.. you see what *almost how the HFT see's price action.

Friday, January 4, 2013

A look back at a Weekly $ES_F chart from December 10th | $ES_F

Daily ES_F
 In previous post by Hedge.ly we discussed the spooz bullish inverse formation and a right shoulder being carved out... the right shoulder ended up holding as the cliff deal was positively sealed.

 So for today we broke over 1360 in ES which is over the 9/14 ledge high which eventually took us down to 1333.25 forming the head of the inverse H&S we popped out of today.
Over the 1433 means the right shoulder breaks upward with a eventual conversion goal into 1468 with 1480 being a target.. this level coincides with the up-trendline (purple dotted) from 1262 extended upward into time. 

Monthly JP Morgan Chart update - Firing on all cylinders? | $JPM $XLF

5 min JPM. note 45 B/O today
We last spoke about $JPM back in early June (original chart) after the market fell violently off highs coupled with the commodity correction.. oil 103-high 70's remember?? .. anyway..

We thought it was a good idea to get into this name around 34 bucks for a swing back to highs based on the chart pattern and general tape feel.  Today JPM traded 45. New chart below

Thursday, January 3, 2013

Gold futures act out post FOMC as US dollar futures gain

30 min GC - note green arrow @
1670 failure
 Today was quite the day when speaking to correlation among the equity complex and the commodity complex. You had a marginally strong equity tape with weak gold, crude, silver, copper futures.

Specifically this evening gold failed the 1661 metric as we first highlighted on our twitter feed.

Wednesday, January 2, 2013

After much fulmination in media the $XHB placed a 5 year high today |

XHB 4 hour 
Quick note here as XHB broke out to the upside post 'fiscal farce' resolution/new years rally etc.

Our XHB journey started on January 18, 2012 with a little guess this chart game.

The gap clear over the 27 level into 27.49 was quite powerful today leaving a equally interesting as highlighted below.

The First Trading Session of 2013 concluded with a bang |

15 min ES - note 
As technicals aligned with headlines so to speak, the perfect storm has passed leaving the NDX up 85.54 points or 3.21% to close .48 & the SPX added 36.23 points or 2.54% to close @ 1462.42.

The real story here is the Russell 2000 small caps as they broke out to multi year highs this morning after the index played possum for months. Chart below

First Session of the year S&P futures Look | $ES_F $SPY |

15 min ES- note the gap over cyan 
Well well well... the buyer within the final 5 minutes of Friday/2012 where115,xxx contracts exchanged hands really look good now that the ES_F is indicating a open +26 points or 1.83% @ 1446 with 1448.25 being the high.

Washington came to a resolve and the markets are continuing on their path of least resistance as discussed prior though this does not mean chase this means if you played this to the long side over the weekend you we rewarded handsomely and should take profits like a gentleman.

Newer Posts Older Posts Home