 |
| XHB 4 hour |
Quick note here as XHB broke out to the upside post 'fiscal farce' resolution/new years rally etc.
Our
XHB journey started on January 18, 2012 with a little guess this chart game.
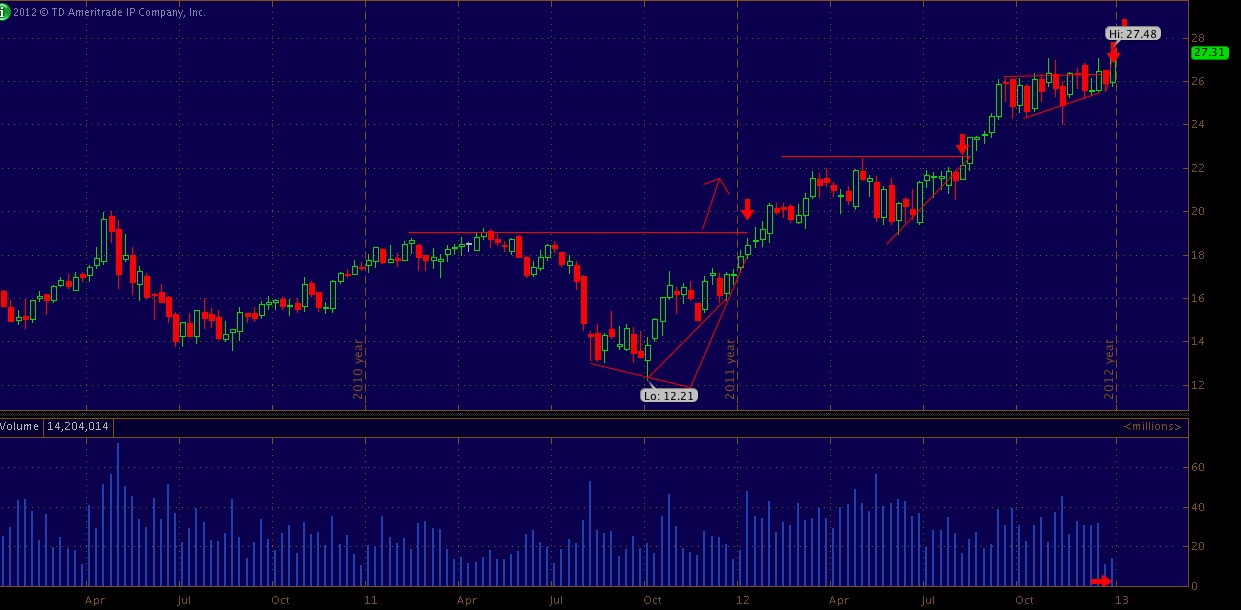
The gap clear over the 27 level into 27.49 was quite powerful today leaving a equally interesting as highlighted below.
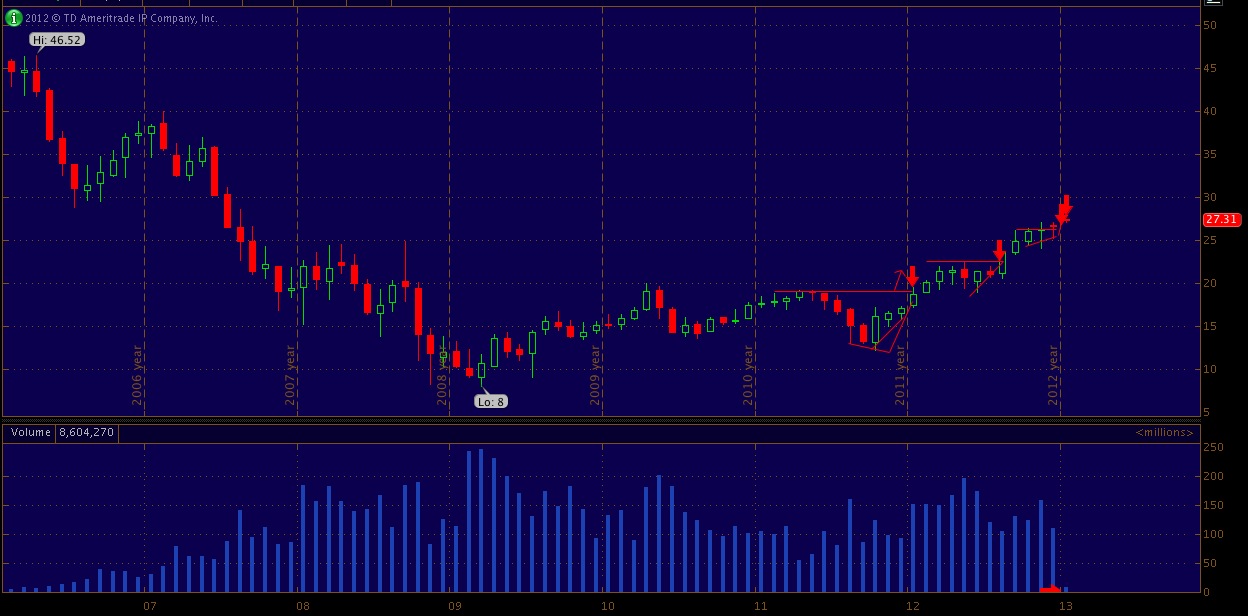
The last time this ETF traded around this level the US housing markets were entering the early throws of the crisis. The stock slide commenced in the fall or 2008 if you remember. Still a lot of work to be done with the housing inventory but progress has to come from somewhere.
 |
| 15 min XHB- note volume today |
 |
| Monthly XHB |
 |
| Weekly XHB |
Posted in: Chart,home builders,XHB