
Would you like the TFP Morning Letter delivered to your inbox by 9 am ET as well as access to private twitter feed?.... Subscribe Here.
SP 500 E-mini Future
|
| 30 min ES |
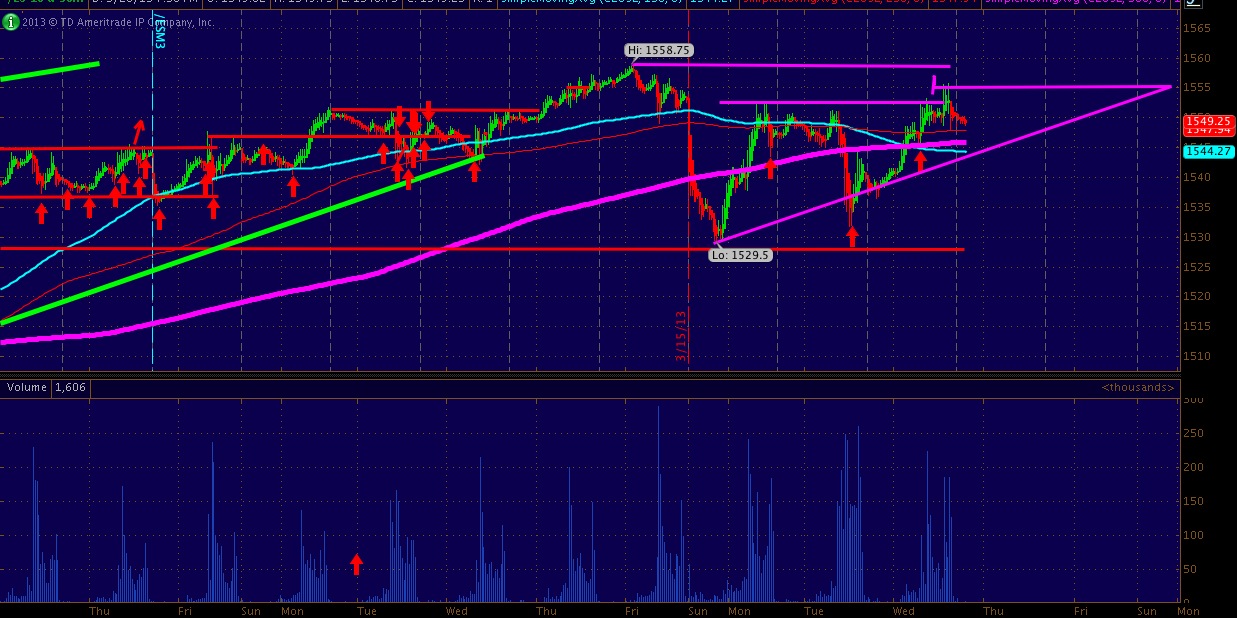
Nonetheless the ES closed higher by 7 points after trading into our morning letter target of 1555 IF the ES broke over, thus the HOD is now resistance @ 1555.75.

|
| 1 min ES |
*note in the chart below the sharp sell off following the high of the day print @ 14:45hrs. I find trend reversals curious in regards to (algo influence) when they occur on a round number on the time line @ a round number on the time axis.. A example of this is as the 94.47 high in CL yesterday precisely @ 7:00 am CT before the sharp 2 dollar drop.
With all the being said.. based on the chart to the right a break under 1548 will trigger a move into 1545.. .if 45 fails it is back to 40.. if 40 fails.. back to 35... Pretty simple, i know you want some fancy formula or trader pseudonyms but it really is 5 point rotations dominating the price action. Simplicity or complication does not matter if you P&L is green.
FX & T-Complex
|
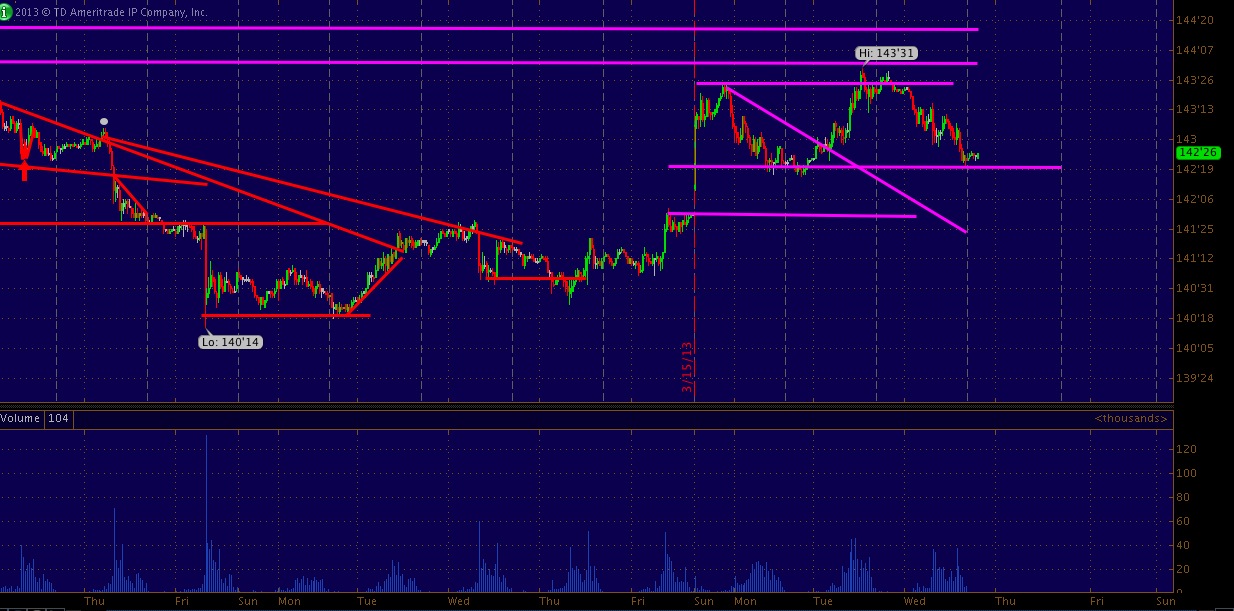
| 30 min ZB |
Bullish how? Well the fact the FED is still sticking to their hawkish views of removing the punch bowl as data improves is reflecting in the value of the dollar....
|
| 5 min DX note the gap under Monday low |
Less dilution of the dollar = stronger dollar and a strong USA. On top of the DX strength you have to take into account the fact the index is up for a solid two straight months so a pullback from profit taking might not really affect correlative pricing when speaking to historical correlations.
Nasdaq 100 Mini Future

|
| 1 min NQ |
This means 2780 is the line in sand before we lurch into the the RED box which shows a gap into 2766 tough 2770 i think will see some support if it does trade.

|
| 5 min NQ |
If apple fails 450 tomorrow the NQ sauce will be spilling all over 2760.
Crude Oil
|
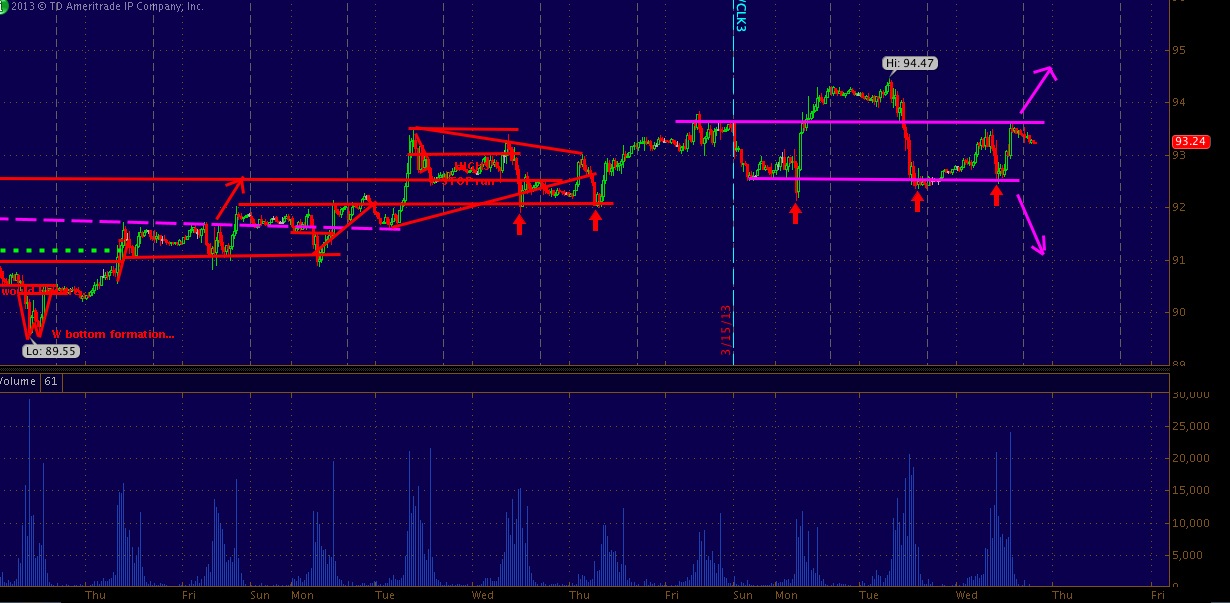
| 15 min CL .. a H&S is arguable neck @ 92.50 |
The CL price was taken down into the 92.50 level, though true to form... the level held like a champ..
BUT keep in mind the longer 92.50 holds the greater the mass becomes of the sell stops located under the level.. SO IF 92.38-50 fails with conviction i can almost guarantee you will see a drop into 92 shortly thereafter.
That being said upside resistance to watch for buy stops over is 93.54 which will thing bring the Tuesday morning high of 94.47 into resistance . OVER = 94.75 then 95. IF DX relents further should solidify the BID barring any other macro news.
| ES_F | NQ_F | CL_F | TF_F |
|---|---|---|---|
| R1: 1550.50 | R1: 2790 | R1: 93.54 | R1: 945 |
| R2: 1555.75 | R2: 2798 | R2: 93.75 | R2: 947 |
| S1: 1548 | S1: 2780 | S1: 93.25 | S1: 944 |
| S2: 1545 | S2: 2770 | S2: 93 | S2: 943.50 |
No content provided within the "trade for profit" or "TFP" morning letter & or market summary constitutes investment advice. "Trade for Profit" is not a financial advisor & does not recommend the purchase of any stock, option, futures contract or offer advice on the suitability of any trade or investment. Actions you take as a consequence of any analysis, opinion or advertisement within this letter are your sole responsibility and at your discretion. Any Letter content is for educational purposes only.
Charts source: Think or Swim. TFP is not associated in anyway with TDAmeritrade or Think or Swim and makes no claims as such. No REPRESENTATION IS BEING MADE THAT ANY ACCOUNT WILL, OR IS LIKELY TO ACHIEVE PROFITS OR LOSSES SIMILAR TO THOSE DISCUSSED WITHIN THIS LETTER. PRODUCTS AND SERVICES SHOULD BE USED AS A LEARNING AID. IF YOU DECIDE TO INVEST REAL MONEY, ALL TRADING DECISIONS ARE YOUR OWN. PLEASE do not reproduce or re-transmit without explicite permission from TFP owners.


