

SP 500 E-mini Future
|
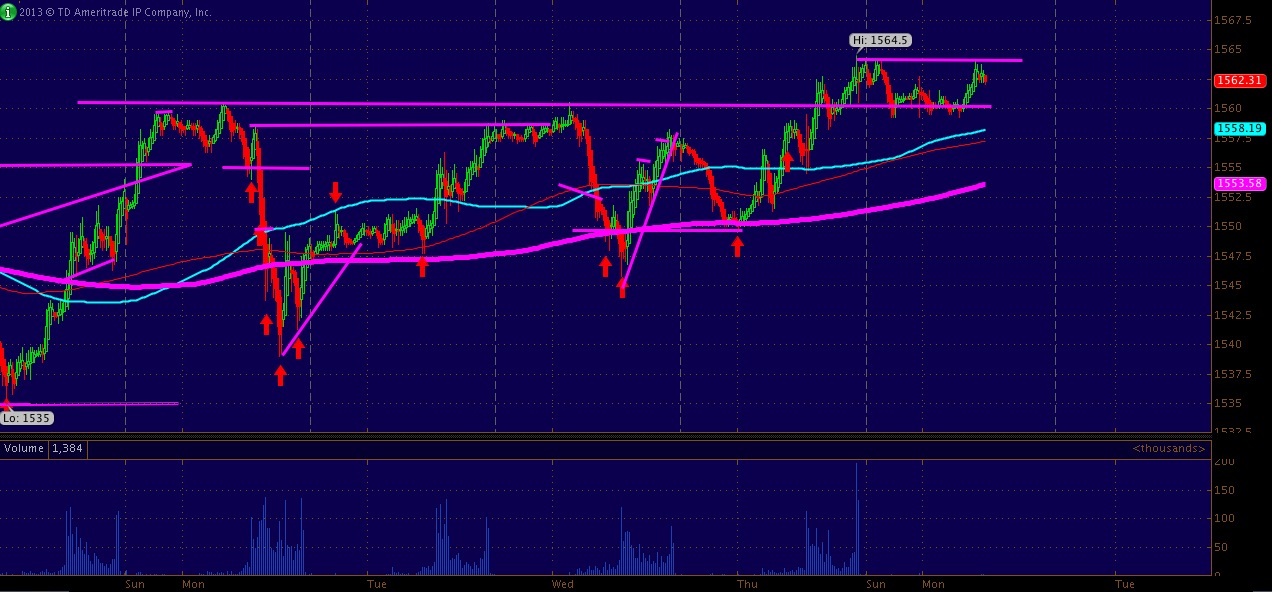
| 15 min ES |
The weak 30 year as well as moderately weak dollar are helping to keep the easy steady over 1557.75 support. 1555 is the line in sand before we see 1555-1550 act as support before we revisit Thursday's lows of 1545.75.
My take, the ES goes higher if the 30 year breaks under 144 and the DX moves closer to 83 support. Also keep in mind today is the first trading session of April so there will be fund flows fighting the ebb and flow of the market.
FX & T-Complex

|
| 15 min ZB |
A break under 144' could fuel a upside move into buy stops in the ES 1565+, but bonds really have a ways to drop before the ES really starts getting bid up.
Currently the DX is lower by 0.04 cents to 83.135 with the low to watch before sell stops at 83.05. The 83 level has held for a week now which means under 83 should help to drive commodity prices a bit higher. DX could reverse to the upside over 83.20 clamping further on crude.
Nasdaq 100 Mini Future

|
| 1 hour NQ |
In order for a break over 2820, the NQ will need all the components on the same page; specifically AAPL. W
hat i mean by this is, the NQ trades like a choppy beast if one or more major components are trading against the trend; such as AAPL moving straight down off open while its peers exhibit relative strength.
Crude Oil

|
| 15 min CL. note arrow under 95.60 |
The low is 96.42 thus sell stops will take hold of the price if the low were to fail into 96.25 with 96.00 being the line in sand. A break under 96 = 95.50 as CL is still trading in .50 fits and starts, profit from it.
A reversal in crude will occur if somehow CL can meander back up over 97, this will put the squeeze on overnight faders; but gun to my head says 96.25 is going to be tested and likely fail which was the low from Thursday as well as the head of a inverse H&S pictured above.
STOCKS
Shares of apple are slightly higher to 443.50 up from a 442.66 close Thursday; 444 is resistance 450 is the pinch level. 440 is line in sand support. Below = back to year lows for the name.
Shares of BBRY are higher to 14.63 after close at 14.45 Thursday, watch for buy tops over 14.70 for a possible squeeze into 15.
Texas Instruments raised its lower end guidance which puts Thursday's high of 35.50 as resistance. I am looking for a break over and hold to give a long signal. under 35.40 i do not like it.
| ES_F | NQ_F | CL_F | TF_F |
|---|---|---|---|
| R1: 1565 | R1: 2820 | R1: 96.75 | R1: 948 |
| R2: 1558.75 | R2: 2830 | R2: 97 | R2: 951 |
| S1: 1557.50 | S1: 2810 | S1: 96.50 | S1: 945.50 |
| S2: 1550 | S2: 2800 | S2: 96.25 | S2: 942.50 |
Want the TFP Morning Letter delivered to your inbox by 9 am ET? Subscribe Here for $25mo.
No content provided within the "trade for profit" or "TFP" morning letter & or market summary constitutes investment advice. "Trade for Profit" is not a financial advisor & does not recommend the purchase of any stock, option, futures contract or offer advice on the suitability of any trade or investment. Actions you take as a consequence of any analysis, opinion or advertisement within this letter are your sole responsibility and at your discretion. Any Letter content is for educational purposes only.
Charts source: Think or Swim. TFP is not associated in anyway with TDAmeritrade or Think or Swim and makes no claims as such. No REPRESENTATION IS BEING MADE THAT ANY ACCOUNT WILL, OR IS LIKELY TO ACHIEVE PROFITS OR LOSSES SIMILAR TO THOSE DISCUSSED WITHIN THIS LETTER. PRODUCTS AND SERVICES SHOULD BE USED AS A LEARNING AID. IF YOU DECIDE TO INVEST REAL MONEY, ALL TRADING DECISIONS ARE YOUR OWN. PLEASE do not reproduce or re-transmit without explicite permission from TFP owners.


