

 |
| 32 handle 16 second (click for larger) |
The question... "how can the market drop that far that fast?" Is easier to answer with the chart on the left.
 |
| whole crash from very top 2 mi 20s |
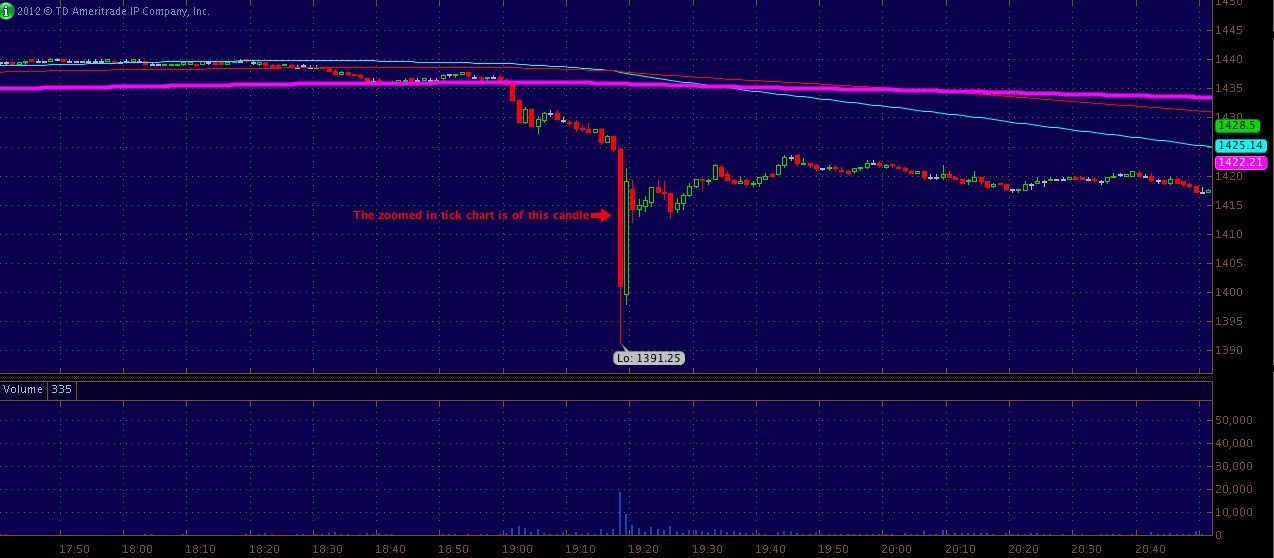
You can see by the purple arrows in the above chart the selling started up 1422.25 then proceeded to tumble into 1391.25 before the market found a bottom and recovered almost as fast. Much like the FLASH crash on May 6, 2010 just MUCH MUCH faster.
The chart below shows the 1 min candle in-which the 'flash' occurred last evening post fiscal talks failure..
 |
| 1 min ES zoom |
The market is held together with tinker toys and i along with many others have publicly voiced concerns about the next crash occurring in seconds not hours not days. I guess we got out lucky this time.
h/t @Tickscollector


