

Kinda spooky.... will history repeat itself for a 3rd time with a failure of the 1550 area resulting in a crash below S&P 1000? or will we defy all the negativity and continue to meander towards 1550 without the "GIGANTIC H&S" completing itself as 2013 gets going.
If you look closely you will see during December of 1999 the ES traded between 1355 and 1489.
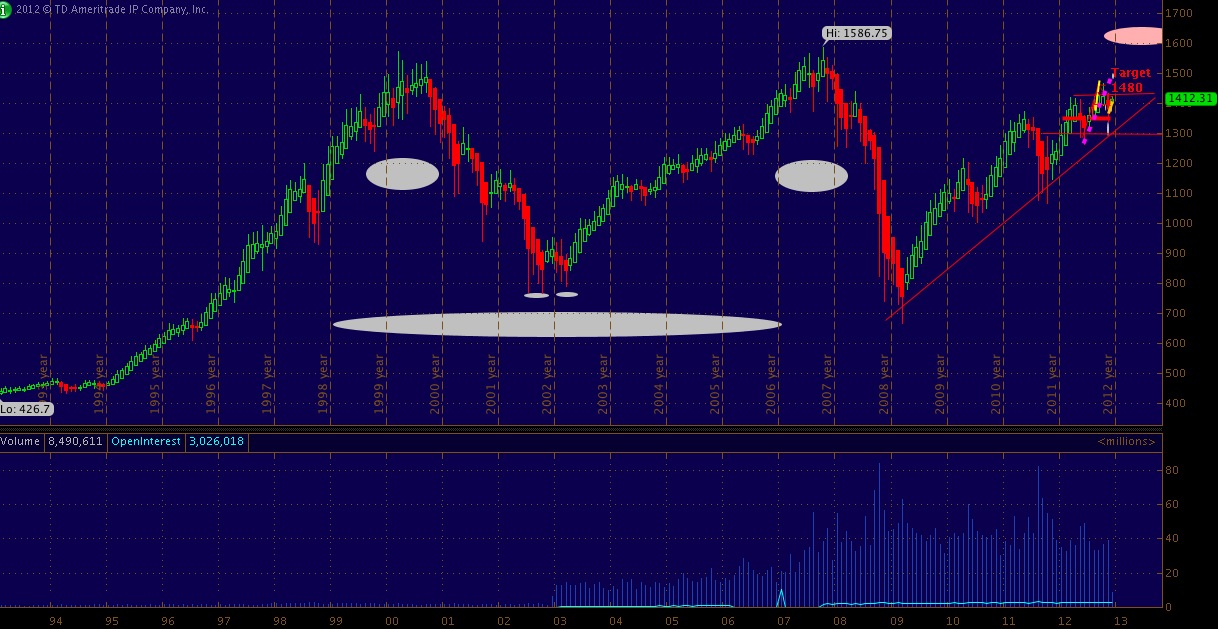 |
| 20 year ES |


