 |
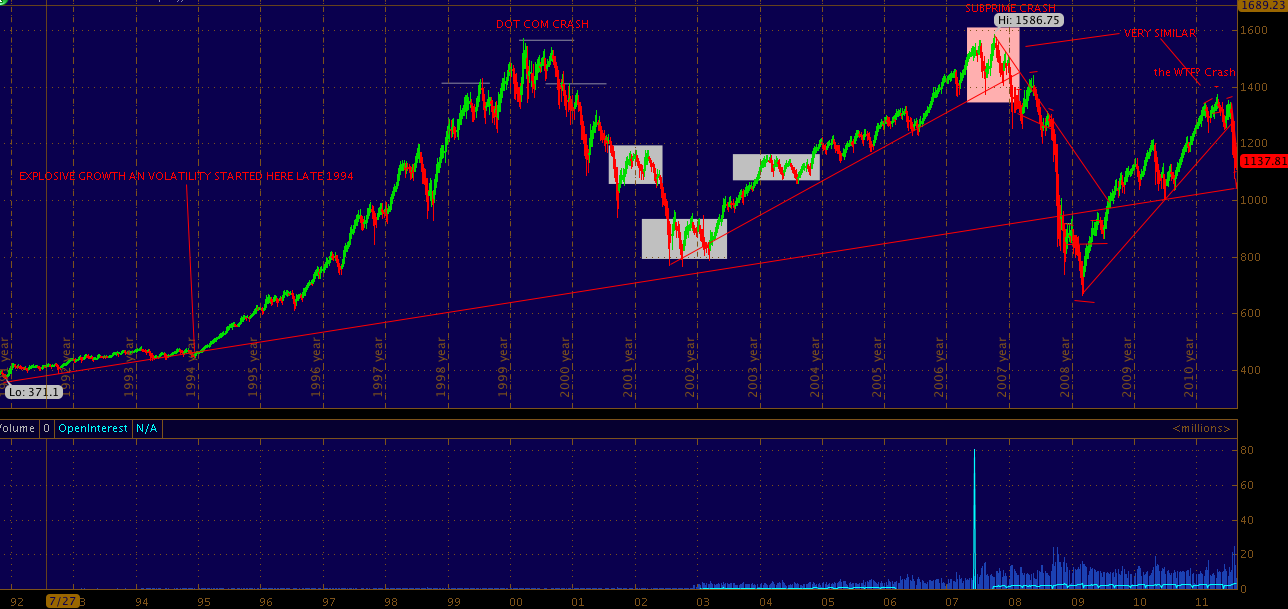
| 20 year weekly candles 1992 to present.. What makes this chart very interesting is the up-trending line which has was defended in 1992, 1994, 1995, 2002 FAILED in 2008 & 2009 BUT defended again in mid 2010 and perhaps now in mid 2011.... |
The question is will the trend line which started in 1992 provide a level of support or will the headwinds become to great as the machines and federal reserve fail to contain the volatility which you can CLEARLY see in the chart which started in 1994 and is culminating currently.. notice the VOLUME in the ES contract for the year, over 20 million .. this is the first uptick in volume since late 2008 over the 20 million level... and guess what IT IS ON SELLING.. not buying.
I am merely the narrator, you are the trader.


