|
| 5 min ES |
Support in ES is now 1525 with 1520-1515 being a air gap. 1510 remains the line before 1500-05 air gap becomes the trade. Over 29's = 35.
|
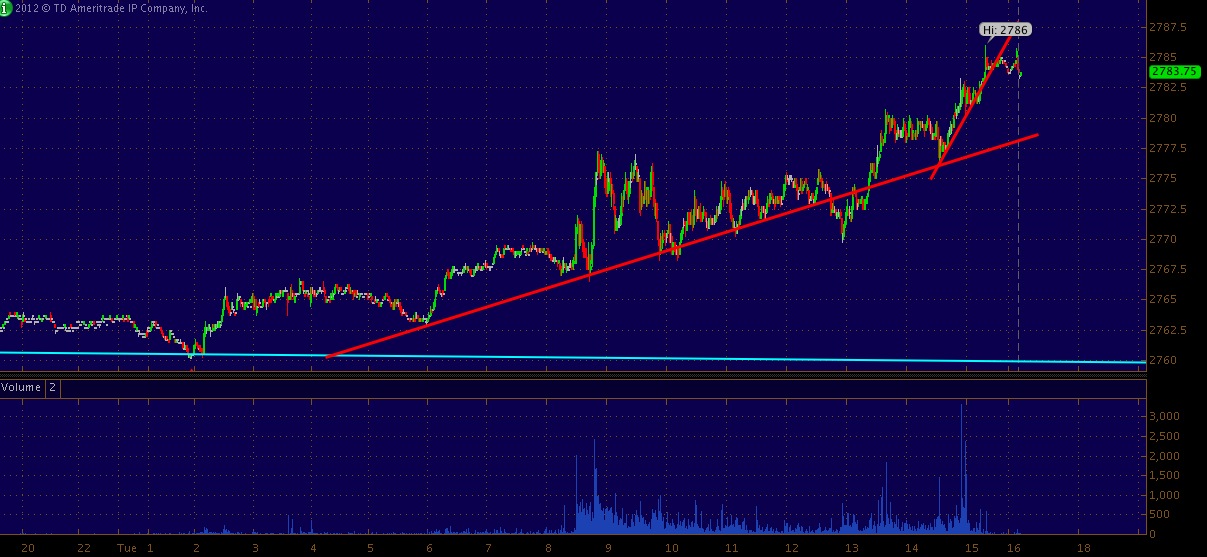
| 1 min NQ. note red arrow @ 2760.55 |
That being said NQ closed well over the Cyan line we found to be a interesting level last week. Our visual system placed a good deal of confidence on the the test of the 2760.65 level as a buy signal, which turned into a 25 point runner.
The NDX closed higher by 18 points or 0.66% at 2782.84. The elusive 2800 level remains elusive. Support is 2775 with resistance @ 2785-2800.

|
| 4 hour NQ - note Cyan |
A break down in the 10 and 30 year bond added, in my mind; fuel to the upside fire in equities. You can argue with me all you want but day after day for the past two months equities have seen their best trending days when bonds break down though the 143 level in ZB is sticky and 142 is still strong support.
115.50 and under in TLT would means ZB should be pushing below 142.
Gold broke down this morning though the 1600 level held as support further solidifying the level as a level where sell stops are lurking. Currently gold is 1604.70. Copper continuing to fall is something different despite the equity and crude rally, though copper has been much of a mirage the past year.
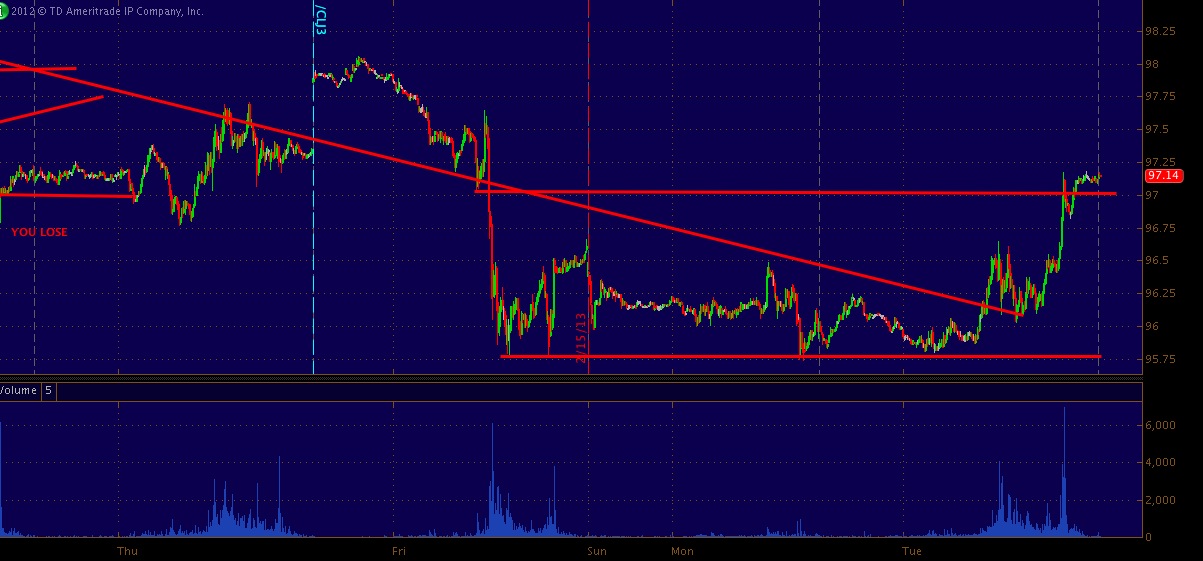
Crude oil futures remained bid throughout the entire day following their standard morning RIP then DIP then RIP. The 95.78 level was morning support which held twice before the price pinched up over 96.15 into 96.50.
|
| 5 min CL |
Financial's outperformed today, which was expected due to the fact $JPM traded into a multi-year high and broke over the key resistance level of 48.36 level gave way to 49.68 today. We first talked about a tradable pattern in $JPM back in June of 2012.