 |
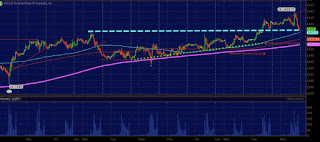
| 5 min SPY |
As predicted yesterday
evening.
"SPY specially.. this amplifying pattern.. focus on the cyan line.. the squares are prediction .. triangles past data. This could indicate another positive open with sellers quick defend."
SPY gapped into 144.02 and ran into a high of 144.55
before fading into negative territory only to close slightly in the green by .07c @ 143.51.. How is that for a fade? a bit much i would think when taking into account how far the IWM's/RUT fell in the last 1.5 hours of trading (837-828.50). Chart below the jump
 |
| 15 min ES_F ..note the sharp drop from the megaphone resistance at 1438.75 |
Based on current support we are looking at 1425 as support under this level means we have a lot of air 1419.25. The 1425 support level coincides with 12/2 morning resistance where high prices failed in the morning into lows under 1410 from 1423.50.
1413 is is support if 1419.25 fails on the 30 minute time frame.
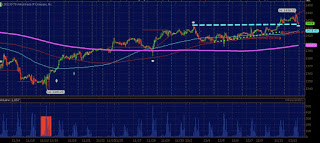 |
| 30 min ES_F - note the white dots of the cyan dashed line from 12/2 to today with white dot under cyan |
Posted in: Chart,Market,SPOOZ,SPY


