
The S&P's marched into a new 2013 and 5 year high of 1568 this morning before giving up 80% of their gains as Apple weakness once again influenced the entire tape.

|
| 5min ES |
The spooz is currently trading down .25 points to 1564.25 as the DX rises to 83.235, taking out morning resistance of DX from Monday. Which is funny because Copper made a high of 3.386 and GC dropped to 1563.10 down 7points all as the DX continues to rise...

|
| 15 min ES. |

|
| 30 min DX... |
The break down the 30 year under 145 helped to solidify the flows into equities which surely helped keep the SPX over 1560, though beyond this relationship; the market looks increasingly tired. I say this because the DX continues to rise in the face of worsening industrial production data within the USA and abroad.
I will continue to keep this thesis into tomorrow, lower bond prices = stronger ES bid..
DX strength seems to not be affecting the usual suspect crude during the cash session though overnight DX is definitely asserting its dominance over the tape as gold continues to push lower into 1554 support.
A strong DX is good for America on a macro scale, but a dollar shooting higher 4 points every two months is not going to be good for the feds plan to keep equity prices higher UNLESS we the industrial data and GDP somehow turns around.
|
| 15 min CL |
My take on the ES tonight, if 1560 fails we move back to 1555, under 55 = 50, under = 45.. A break back over 1566 means we could easily trade back to 1568; fading record high prints as wear near all time highs will become increasingly gambling like. I think a break under 1560 would provide a great scalp short opportunity for 5 points to the downside. 1570 still the upside target over 68's.
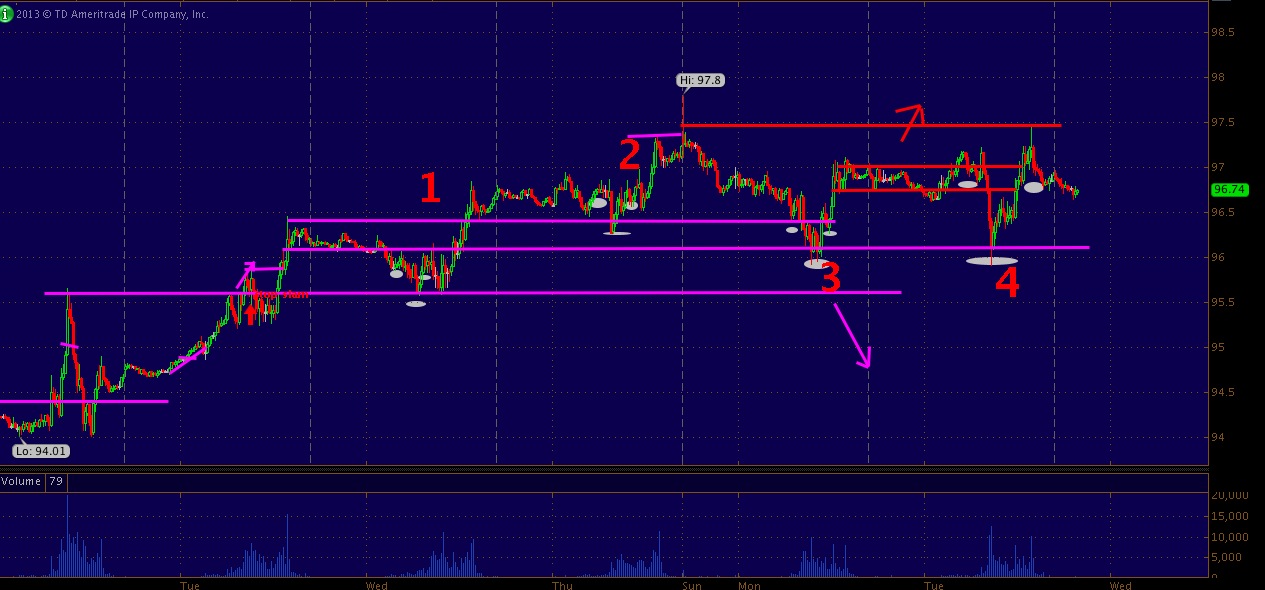
As for Crude.... 96.55 held as support which is 90 cents below the intra day high of 97.44, the week high is 97.80 from Sunday's gap. A break over 97.50 means we test 97.80 on into 98. A break under 96.55 = 95.90.
Notice the 1,2,3,4 on the chart above.. those are highlighted identical patterns each day since last wednesday in CL,, a pattern of of a morning break down into session lows which are bought up into the afternoon to make session highs then fade.. it has repeated 4 times now.
No content provided within the "trade for profit" or "TFP" morning letter & or market summary constitutes investment advice. "Trade for Profit" is not a financial advisor & does not recommend the purchase of any stock, option, futures contract or offer advice on the suitability of any trade or investment. Actions you take as a consequence of any analysis, opinion or advertisement within this letter are your sole responsibility and at your discretion. Any Letter content is for educational purposes only.
Charts source: Think or Swim. TFP is not associated in anyway with TDAmeritrade or Think or Swim and makes no claims as such. No REPRESENTATION IS BEING MADE THAT ANY ACCOUNT WILL, OR IS LIKELY TO ACHIEVE PROFITS OR LOSSES SIMILAR TO THOSE DISCUSSED WITHIN THIS LETTER. PRODUCTS AND SERVICES SHOULD BE USED AS A LEARNING AID. IF YOU DECIDE TO INVEST REAL MONEY, ALL TRADING DECISIONS ARE YOUR OWN. PLEASE do not reproduce or re-transmit without explicite permission from TFP owners.


