
|
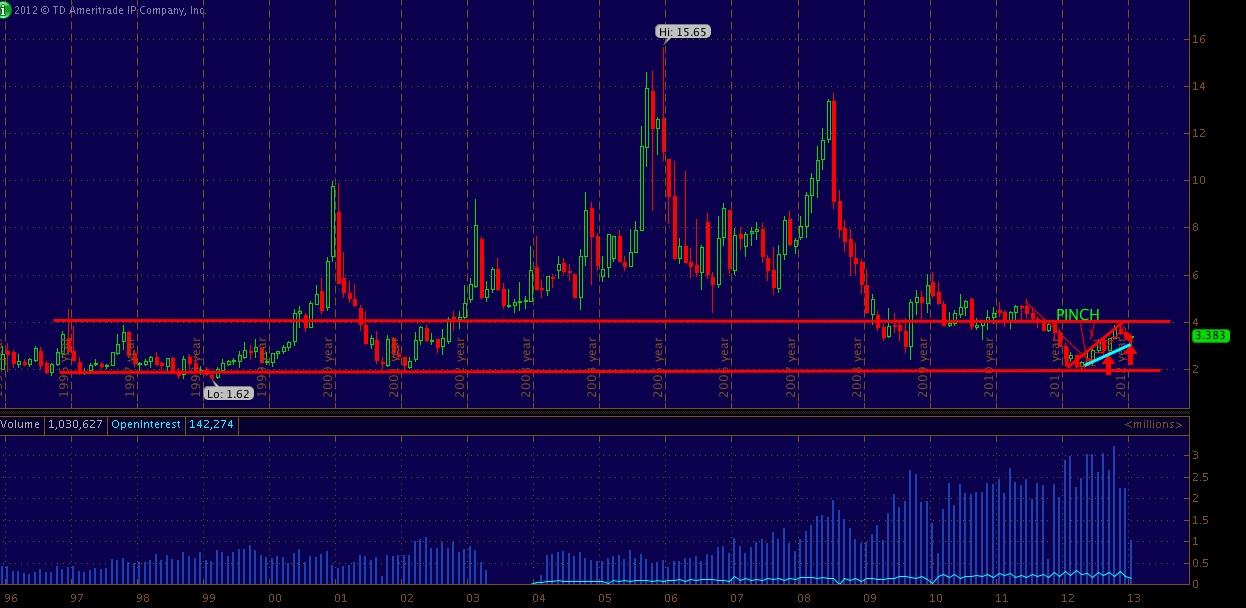
| NG_F 15 year - note the volume crescendo |
When looking at the chart zoomed out you can make a lot more of nat gas trends verses zoomed in minute to minute.
The nature of nat gas is a big mover having regular moves of +or-3% day's clobbering many traders who fail to see the macro trend. With that being said where might NG be going?
When look at the chart above you should focus on the 15 year support level @ 2 dollars with last year's low being 1.902 on April 19th which coincides with the throws of the commodity correction of spring 2012. remember.. CL from 103 - 79 in about about a month...
|
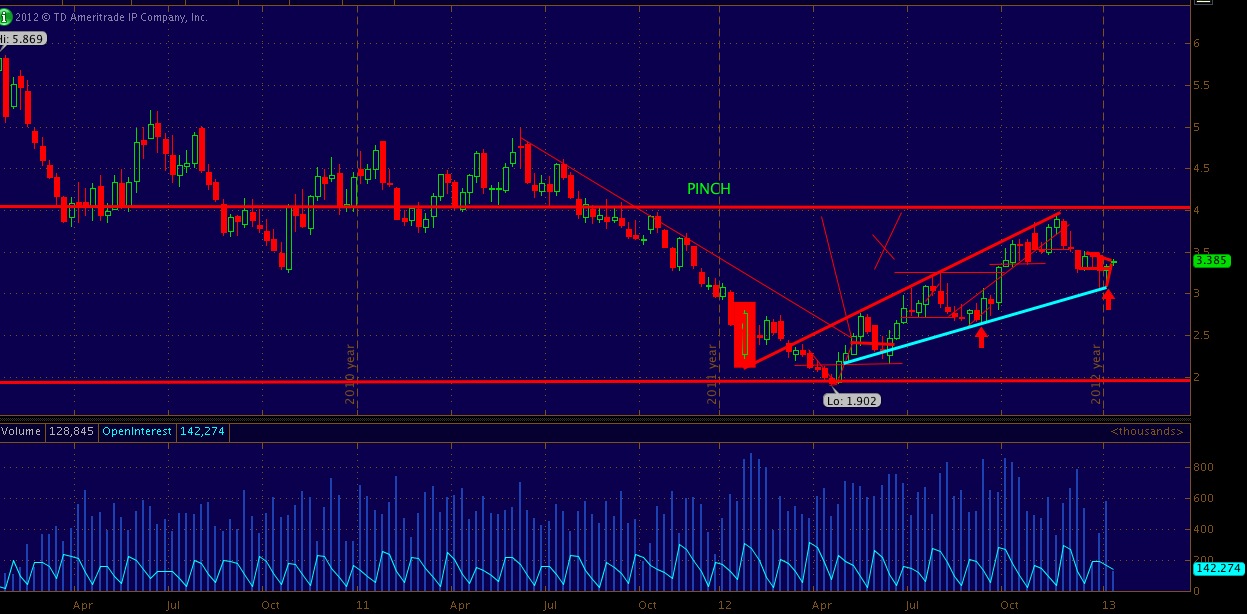
| NG_F weekly |
|
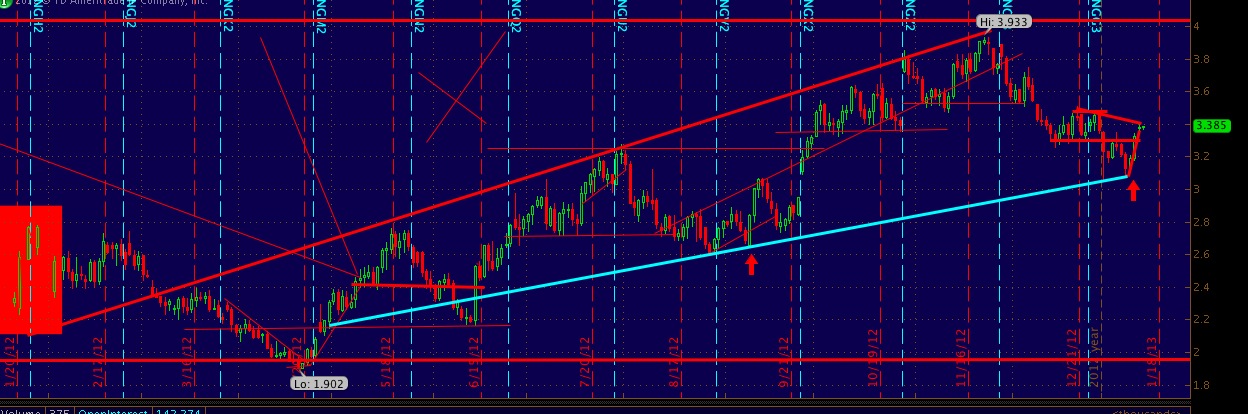
| Daily NG with volume removed. notice the megaphone pattern off the PINCH lows |
Now we are back in the 3-4 channel. If the $4 level can be converted to support on draws off the reservoirs as winter rolls on the price has a chance of creating a new channel of $4-5.
IN order for prices to remain on the upward trajectory demands from electrical generation and vehicle fuel will need to continue to increase with or without government incentives.
|
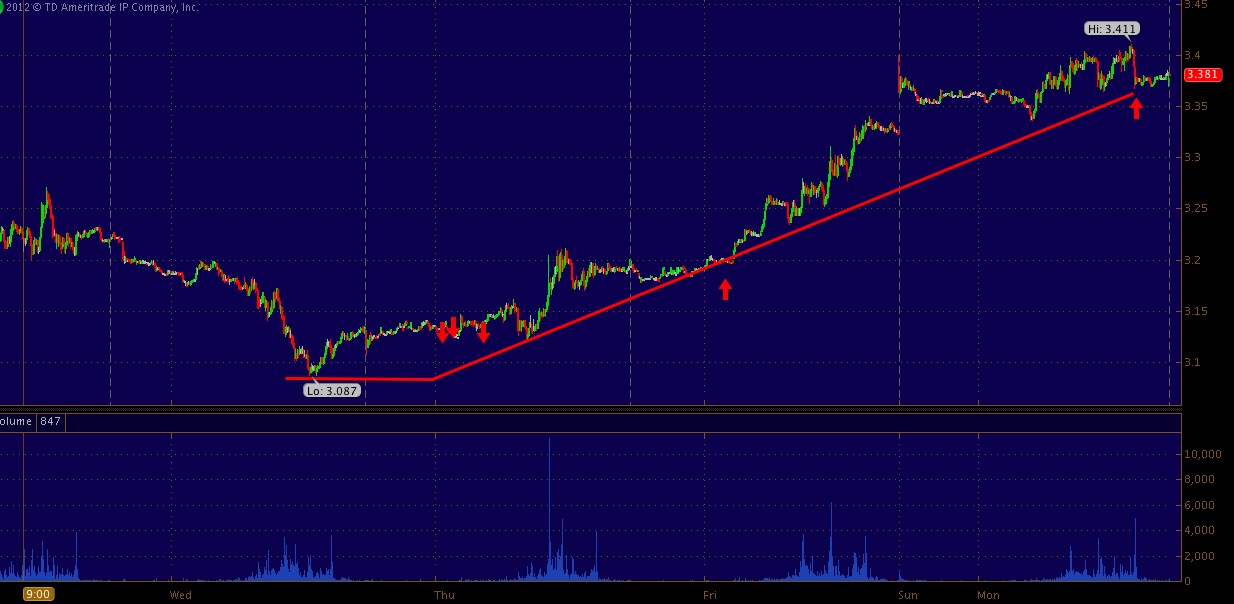
| The move up from the test of $3 and subsequent price action. Notice the violence of price action if you are not zoomed out. |


