skip to main
|
skip to sidebar
Emini Note
Oil Technical Analysis
All Charts
Market Commentary
Social Investing
Triangle Trading
Contact Us
FOLLOW
The Mcverry Report
Themis Trading
Shanky's Tech Blog
HedgeLy Reads
Zero Hedge
36 minutes ago
The Market Guardian | Monitoring The Financial World
Gargantuan and Growing: The U.S. Debt Figure You’ve Probably Never Heard Of
1 hour ago
The Oil Drum - Discussions about Energy and Our Future
4 hours ago
EXSKF
Japan's Abe Mimics US, Will Force Bank of Japan to Have Job Creation Mandate, Modify Constitution to Send SDF to Foreign Wars
13 hours ago
Expected Returns
Discovering the Correct Path in Investing
1 week ago
innerfx.com
4 weeks ago
The Debts of a Nation
Occupy Wall Street - Marine vs 30 Cops
1 year ago
StockWeb
George Soros investments
2 years ago
Bad Follow Thru
The Admin Spin Team Keeps Frittering, While the Republicans Just Scream
2 years ago
Erik's Market Blog
$USD updates
3 years ago
Show 5
Show All
?
+
X
Recommended for you
Loading..
Wednesday, January 18, 2012
Guess this Chart - (XHB)
By Hedge Ly
| 1/18/2012 01:57:00 PM |
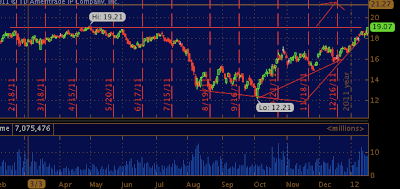
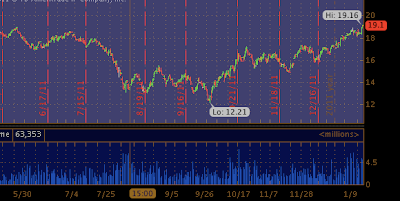
Daily XHB .. another 9 cent over the breakout opportunity i highlighted in the below chart
Answer is - XHB - home builders SPDR
daily
Posted in: Chart,guess this chart,home builders,XHB
Newer Post
Older Post
Home
Attribution-NonCommercial-NoDerivs 3.0 United States
☟ Popular This Week☟
Is it time to take Autozone off autopilot under 340? | $AZO
weekly AZO The retail autopart supplier market has been returning parabolic gains since $AZO took off over 10 years ago in 2000. Since...
The most heinous chart of the week is $AAPL
5 min AAPL. note the close off lows around 515..
Your Guide To S&P Futures Manipulation (SPX)
Notice the candle up to 1198 then down to 1189.75.. then bounced back to 1194 2 min later. total BS games.. 1 min ES
A look at the $ES_F overnight price action & the 15 min Chart
15 min ES Resilience over 1450 further solidified the 1463/1450 channel today as the ES_F further digested the new years run up of nearl...
Interesting $AAPL 5 min chart pattern to ponder
Updated $AAPL 5 min - 5min AAPL
$AAPL shares again under pressure as $AMZN shares make all time highs
This is what $AAPL looks like 1 tick @ a time.. you see what *almost how the HFT see's price action.
Monthly JP Morgan Chart update - Firing on all cylinders? | $JPM $XLF
5 min JPM. note 45 B/O today We last spoke about $JPM back in early June (original chart) after the market fell violently off highs cou...
Search HedgeLy
Archives
Archives
January 2013 (14)
December 2012 (47)
November 2012 (27)
October 2012 (17)
September 2012 (17)
August 2012 (29)
July 2012 (5)
June 2012 (22)
May 2012 (22)
April 2012 (44)
March 2012 (50)
February 2012 (71)
January 2012 (74)
December 2011 (62)
November 2011 (85)
October 2011 (81)
September 2011 (81)
August 2011 (77)
July 2011 (41)
June 2011 (27)
May 2011 (13)
April 2011 (17)
March 2011 (90)
February 2011 (76)
January 2011 (94)
December 2010 (100)
November 2010 (74)
October 2010 (87)
September 2010 (102)
August 2010 (36)
July 2010 (5)
June 2010 (5)
May 2010 (4)
April 2010 (12)
March 2010 (24)
February 2010 (15)
January 2010 (8)
December 2009 (9)
November 2009 (17)
October 2009 (11)
September 2009 (4)
August 2009 (14)
July 2009 (15)
June 2009 (25)
May 2009 (20)
April 2009 (23)
March 2009 (1)
February 2008 (9)
January 2008 (41)