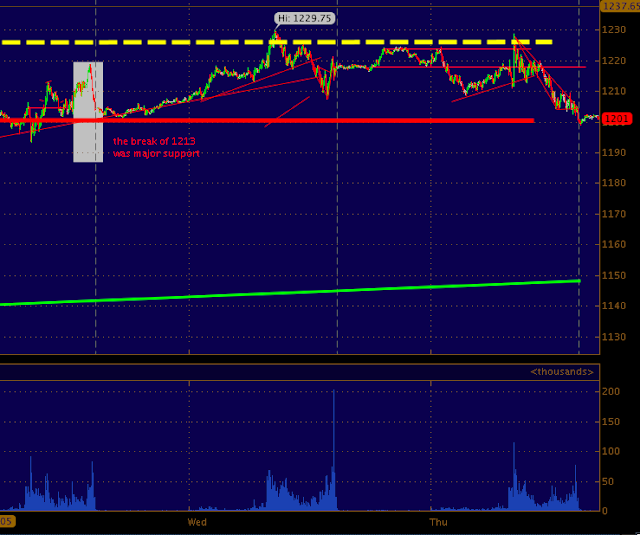
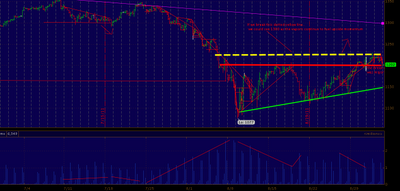
Take a look at the 4hr chart above, you can see a massive wedge forming with 1300 being the top of the pattern and 1150 clearly the bottom at this point in time. The current price of the ES is slightly below the middle of the wedge/flag (1330), the dotted yellow line @ 1330. This level was tested yesterday and this morning only to be defended by the bears. To be fair volume on the upside as well as the downside has been pretty tame, though the same trend we have seen in the past is true.. selling spikes see upticks in volume... this could be a result of fidgety longs and or value players
buying every single dip... my guess is fidgety longs coupled by shorts selling into value player (PPT) bids..
As for tonight the lower line in the sand is 1200, we traded below 1200 briefly after the futures opened at 3:30, what is notable is in the last seconds of the session 1200.75s traded. More bearish foreshadowing like we say Wednesday close as well as Tuesday. Wednesday cash close we saw 108k mini's exchange hands, little signals....
 |
| 30 min NQ |
Looks like September is setting up for more volatility as the economy looks towards jobs and the 4th quarter all while juggling the thought of no QEIII and continued euro worries. What tells me we could be near the top of this rally of nearly 10% in two weeks is a clear disconnect of historical correlation in CL ES NQ DX & GC.... the fact we are seeing gold holding onto 1830 while the dollar is up two days in a row and crude still near 90 tells me the market is not sure what is up.. Watch the treasuries as non farm comes into play ... these disconnects do not last long and usually happen near the tops and bottoms intermediate trends...
 |
| 5 min ES |


