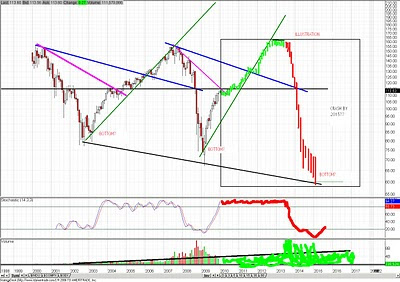
 I put this chart together after quite a bit of squinting last night. (Monthly) The chart is very rough and very speculative but has given me and hopefully you a good visual representation of the next five years trend.
What makes this chart so appealing is both bull and bears get a piece of the action. If we continue this upward trend ignoring fundamentals we can very well move back to previous highs, market psychology will cause the bears to become bulls for fear of missing the next big bull market.
Once everyone is a bull again fresh money will come into the markets pushing stocks even higher on top of the "hand of gods buying". Now that everyone is long and strong and down to get longer a systemic event will crater the markets in 2015? The fall will be on even higher volume causing precipitous selling like we have not seen before.
You might be asking how i derived the chart. I am basing the trends off the previous .com "crash" & 08'-09' fall. The blue and purple lines intersect in very unique ways, yes lines are lines and markets are random but remember "backtest backtest backtest" ha! The wide range of index prices over the last decade show price uncertainty because of an underlying issue in valuation and the economy as a whole. Until the problems are actually solved the market will continue searching for a trend. I firmly believe we need one more hard down move to really flush the system priming us for a 10+ year rally to new highs.
I believe social Darwinism will come into play during the next crash because the house/senate will probably not be liberal controlled and will not prevent POS companies from failing. Let the weak fail, there will always be some other stronger company to absorb the business. Out with the old in with the new.
Posted in: Market,SPY
I put this chart together after quite a bit of squinting last night. (Monthly) The chart is very rough and very speculative but has given me and hopefully you a good visual representation of the next five years trend.


